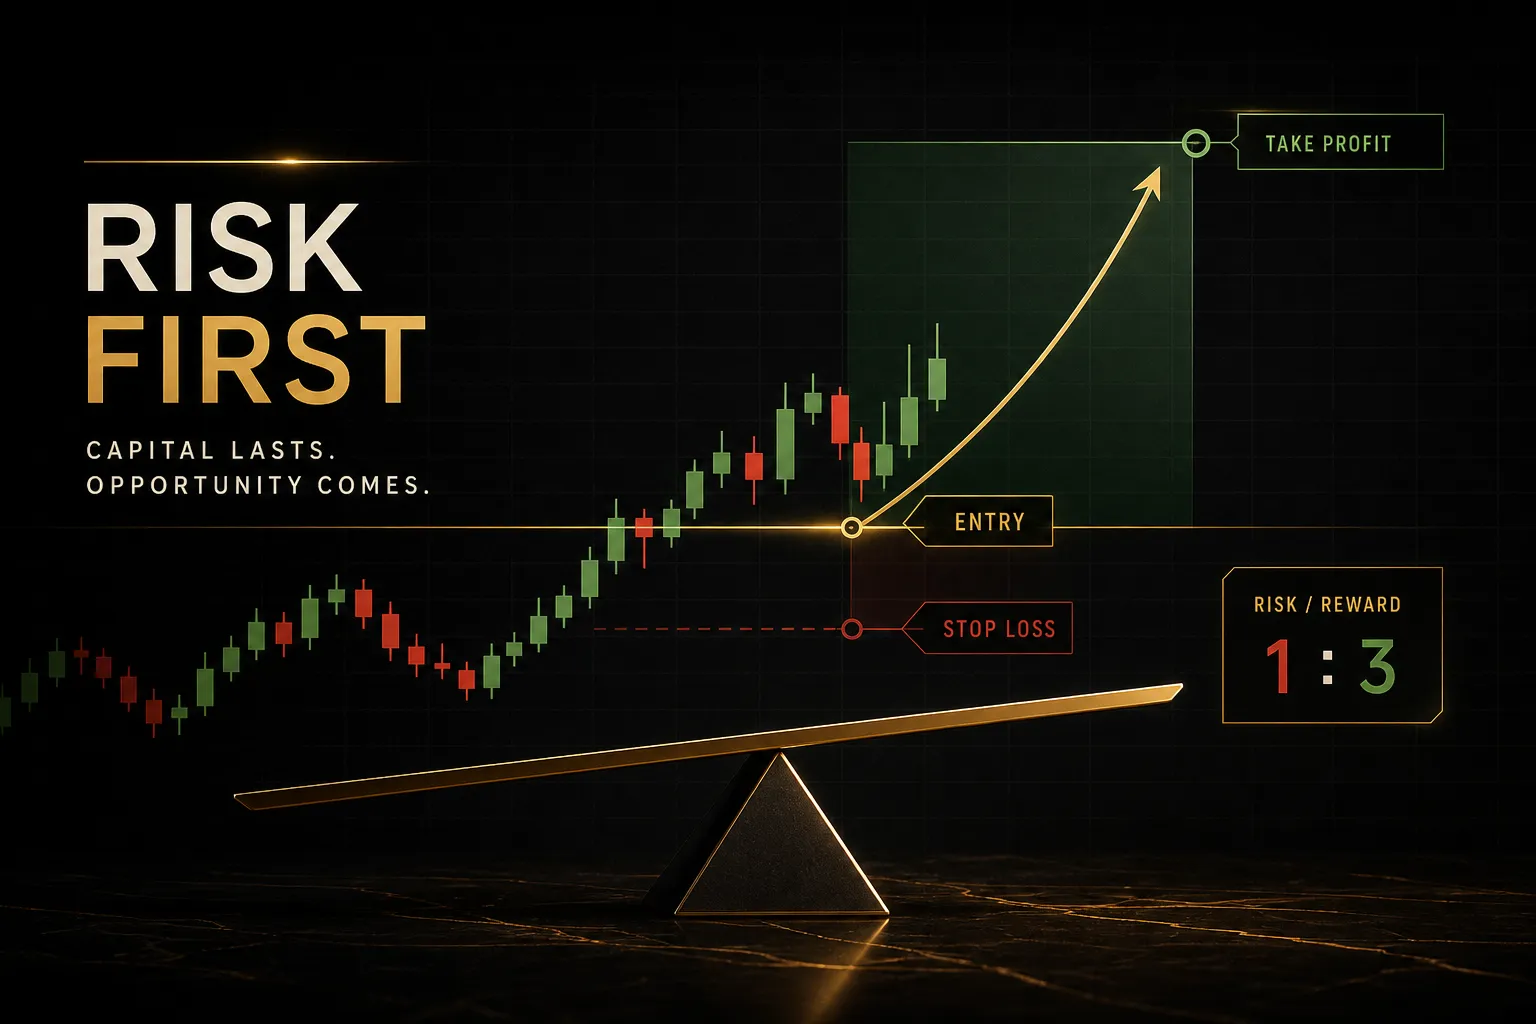
Types of trading explained: styles, strategies, and fit
On this page
Why “types of trading” means three different things
Search “types of trading” and you’ll usually get one long list: scalping, momentum, swing, technical, breakout, position, algorithmic. Those labels answer three different questions.
Mixing them is why so many new traders pick an approach that never fits their week.
Here is the cleaner way to think about it.
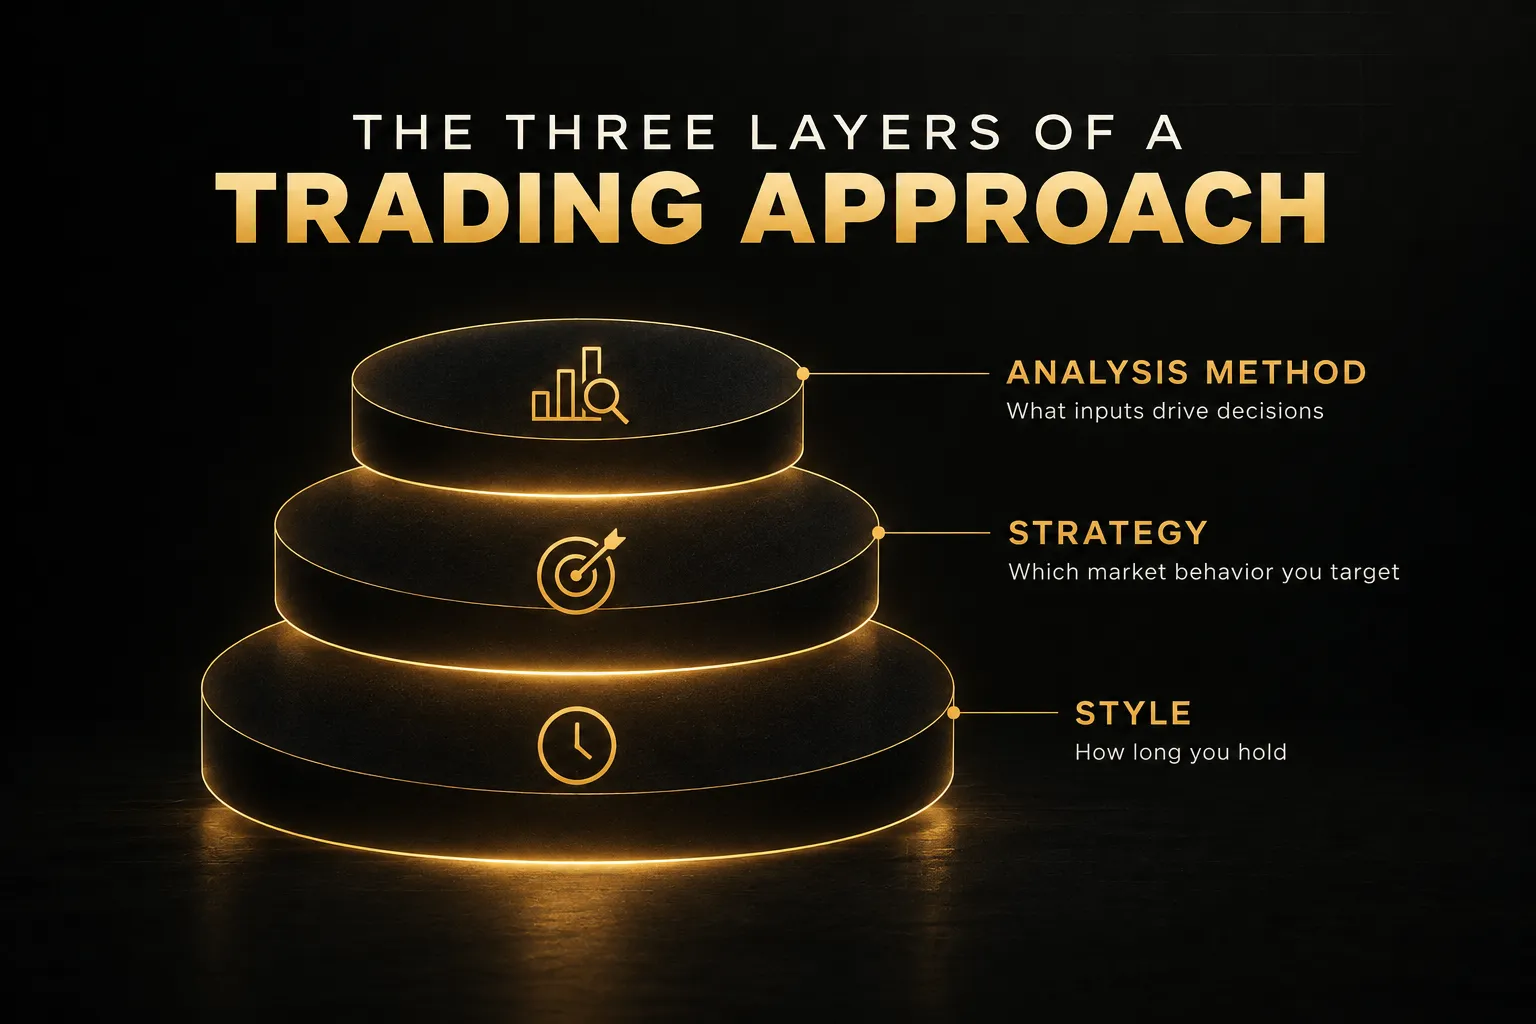
A trading style describes how long you hold a position. A trading strategy describes what market behavior you’re trying to profit from. An analysis method describes what information drives your decisions.
Those three layers stack. A trader can be a swing trader (style) running a breakout strategy (strategy) based on technical analysis (method).
Change one layer and the whole setup behaves differently.
The choice also depends on more than personality. Holding period, screen time, account size, transaction costs, and risk tolerance all affect each other.
A scalping plan that looks great on paper can fall apart once a 1-pip spread eats a third of every target. A position trade that feels “safe” can sit in a 20% drawdown for months.
The useful question isn’t “which type of trading is best?” It’s “which combination of style, strategy, and analysis fits my schedule, my capital, and the market I trade?”
That is the question this guide answers, with every type of trading explained in practical terms as of 2026.
Style, strategy, and analysis method: the real difference
Ask ten traders what “momentum trading” is and you’ll hear about 5-minute charts, weekly charts, and everything in between. They’re all right.
Momentum isn’t tied to a timeframe, and that’s the clue to the whole framework.
Styles are defined by holding period
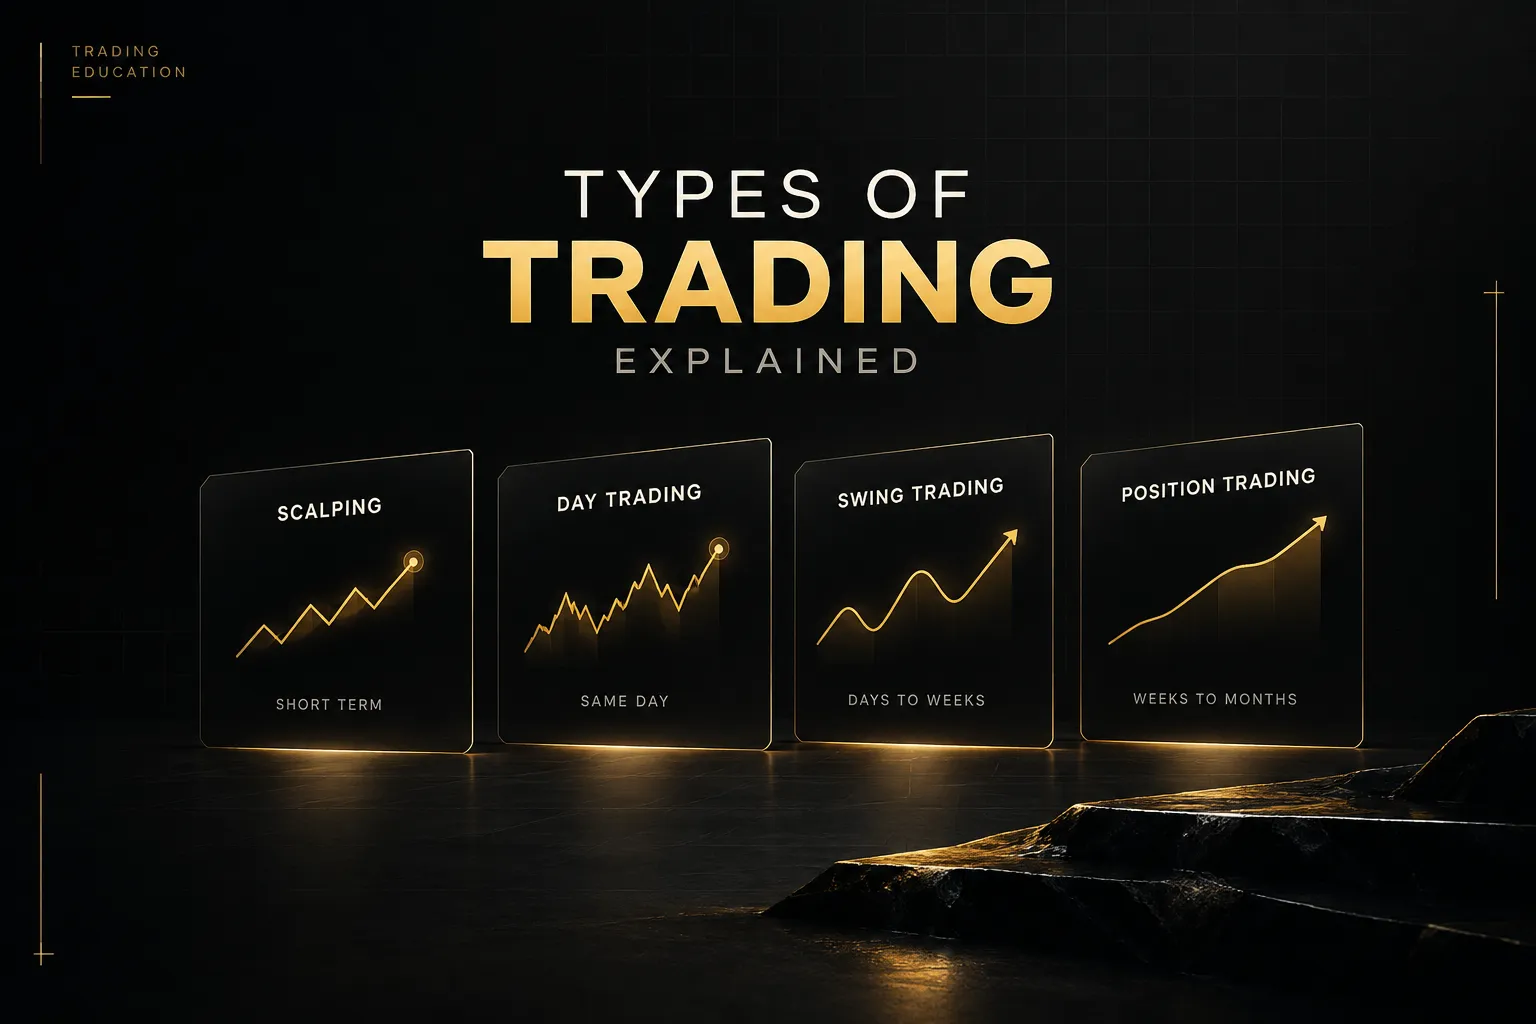
Scalping, day trading, swing trading, and position trading are time-horizon categories.
Scalpers hold for seconds to minutes. Day traders close everything before the session ends. Swing traders hold for days to a few weeks, and position traders hold for weeks to months or longer.
None of those labels tells you why a trader enters. They only tell you how long the trade lives and, by extension, how much screen time, overnight risk, and cost per trade the trader takes on.
Strategies are defined by market behavior
A strategy is a bet on how price tends to move.
Momentum trading and trend following assume moves tend to keep going. Breakout trading assumes price will expand once it clears a defined range. Mean reversion assumes stretched prices snap back toward an average. News trading targets the volatility around scheduled or surprise events.
Each of these can run inside any holding period. A mean-reversion scalper fades 30-second spikes. A mean-reversion position trader buys a sector trading two standard deviations below its 200-day average.
The logic is the same.
Only the scale changes.
Analysis methods are defined by decision inputs
Technical analysis uses price, volume, and the indicators derived from them. Fundamental analysis uses earnings, interest rates, economic data, and valuation. Algorithmic trading codes either input (or both) into rules a computer executes.
The alternative, discretionary trading, leaves the final decision to human judgment.
Think of it like cooking.
The style is how long the dish cooks, the strategy is the recipe, and the analysis method is the ingredients you trust. You can slow-roast or flash-fry the same recipe.
A concrete example makes it clear.
A day trader might buy a stock breaking above its opening 30-minute range on rising volume, using purely technical analysis and exiting by the close. A swing trader might use the same breakout strategy on a daily chart, but only after an earnings beat (a fundamental catalyst) and with a plan to hold for two weeks.
Same strategy.
Different style, different inputs, very different risk profile.
The four core trading styles compared
The shorter the holding period, the more each trade depends on things you can’t see on a chart: spreads, commissions, fill quality, and your own reaction time. The table below compares the four core styles on the factors that actually decide whether they fit.
| Style | Holding period | Typical screen time | Execution speed required | Capital and cost sensitivity | Emotional pressure |
|---|---|---|---|---|---|
| Scalping | Seconds to ~15 minutes | 3 to 8 hours of continuous focus | Very high; fills in milliseconds matter | Extreme; spread and commission can equal 20 to 50% of target | Very high; dozens of rapid decisions per session |
| Day trading | Minutes to hours, flat by close | 2 to 6 hours, peaking at session opens | High; slippage around news is costly | High; leverage and margin rules shape position size | High; overtrading and revenge trading are common |
| Swing trading | 2 days to ~4 weeks | 30 to 90 minutes per day | Moderate; limit and stop orders do most of the work | Moderate; costs are small relative to target, but overnight fees add up | Moderate; overnight gaps test discipline |
| Position trading | Weeks to months or years | A few hours per week | Low; entries can be staged over days | Low per trade, but capital stays tied up for long periods | Lower day to day, but long drawdowns are hard to sit through |
Scalping
Scalping is often described as “making many small, quick trades.” That description skips the part that matters.
Scalping is a cost-management business first and a prediction business second.
Take a forex scalper aiming for 3 pips per trade on EUR/USD. If the round-trip bid-ask spread plus commission costs 1 pip, a third of the gross target is gone before the trade starts.
Add half a pip of slippage on fast moves and the strategy needs a much higher win rate just to break even.
That’s why serious scalpers trade only the most liquid instruments during peak liquidity hours, and why they rely on statistically tested trade expectancy: (win rate × average win) minus (loss rate × average loss), measured after all costs.
Without a backtested positive expectancy across hundreds of trades, scalping just turns spreads into broker revenue.
Day trading
Day trading, or intraday trading, avoids overnight risk by closing every position before the session ends. The trade-off is exposure to the most volatile parts of the day: the open, scheduled data releases, and the close.
The practical risks are well documented. Leverage magnifies small moves, and a poorly sized position can trigger a margin call within minutes.
Overtrading is the quieter killer.
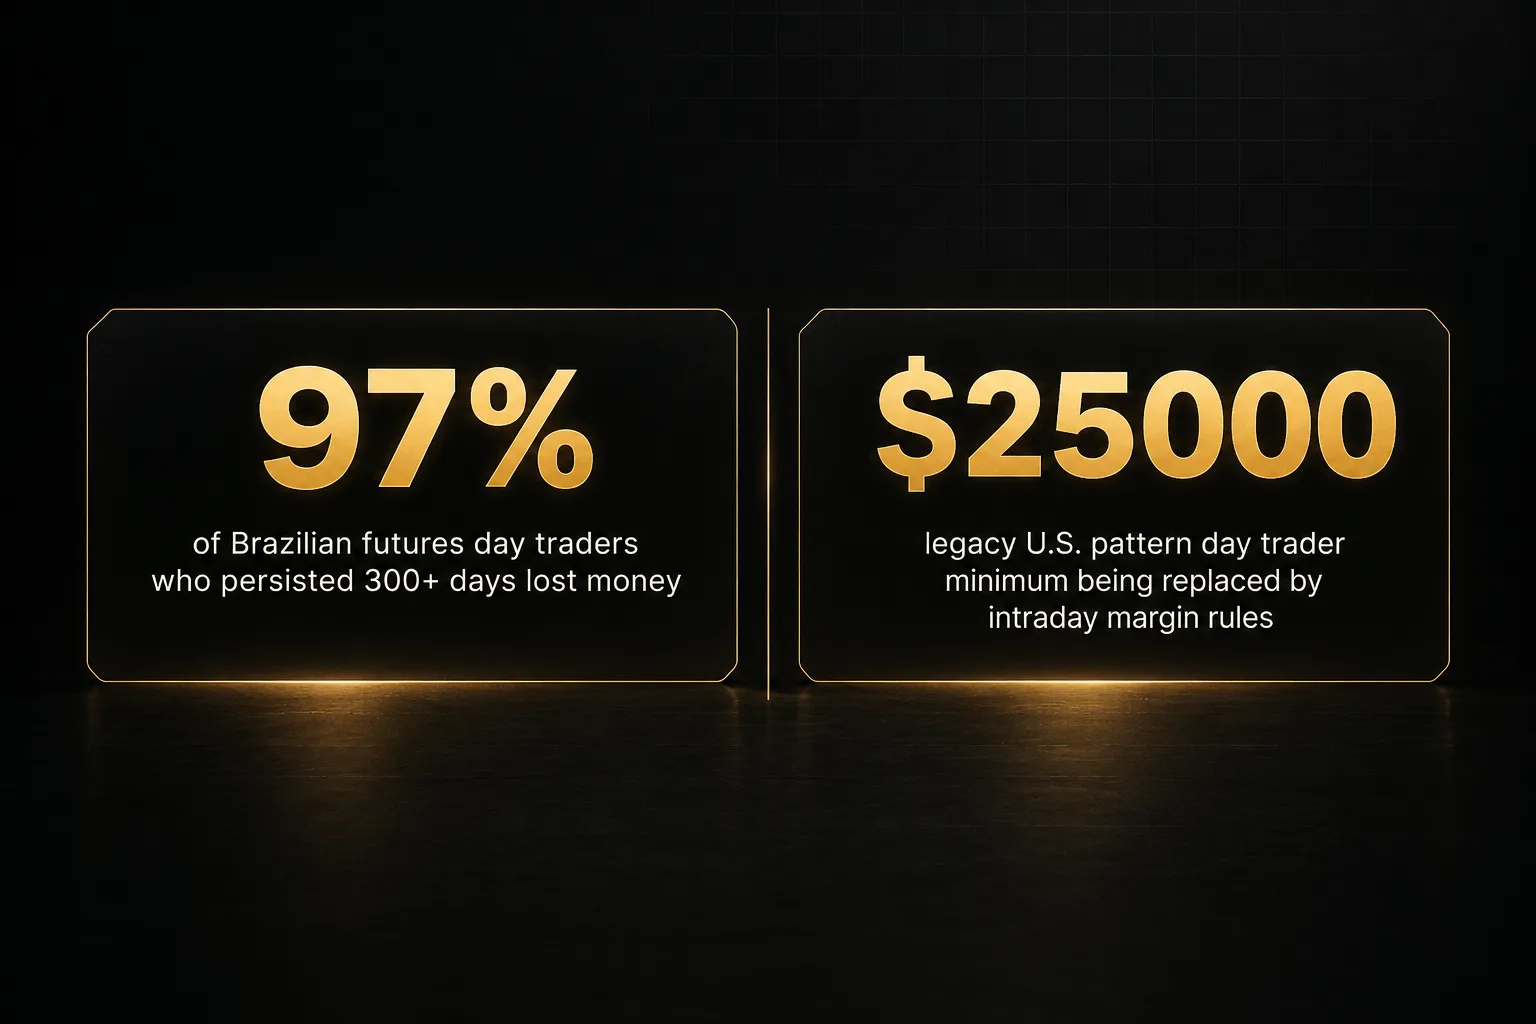
A study of Brazilian futures traders by Chague, De-Losso, and Giovannetti found that 97% of individuals who day traded for more than 300 days lost money.
Rules are shifting in 2026 too. In the U.S., FINRA’s overhaul of Rule 4210 would replace the long-standing $25,000 pattern day trader minimum with intraday margin requirements based on actual position exposure.
Check how and when your broker implements the change, because it affects how much buying power a small account really has.
Swing trading
Swing trading captures multi-day moves, which makes it the most common fit for people with full-time jobs. But holding overnight brings risks day traders never face.
Overnight and weekend gaps can open price well beyond your stop-loss order, so a planned 2% loss becomes a 6% loss at the open. Earnings releases are the classic trap in stocks; a 10 to 15% gap on a report is routine for mid-cap names.
In forex and CFDs, swap or financing charges accrue every night a position is open, and some brokers apply a triple charge on Wednesdays to cover the weekend.
Swing traders also need wider stops because daily noise is larger. Wider stops mean smaller position sizing for the same dollar risk.
It’s a trade-off many beginners ignore until a normal pullback stops them out.
Position trading
Here’s the myth: longer holds are automatically safer.
They aren’t.
Position trading swaps intraday noise for macro risk: interest-rate shifts, recessions, policy changes, and sector rotations that can grind against you for months.
Drawdown duration is the hidden cost. A position trader following a trend might sit through a 15 to 25% drawdown that lasts a quarter or more before the thesis plays out (or fails).
Correlation exposure compounds this; five “different” tech positions often behave like one large bet.
Then there’s opportunity cost. Capital locked in a sideways position for six months can’t be used elsewhere.
Position trading needs fewer decisions, but each one carries more weight.
Matching a style to your schedule, capital, and market
“Are you patient or impulsive?” is how most quizzes match traders to styles.
It’s the wrong starting point.
The factors that actually decide fit can be measured, and most of them have nothing to do with personality.
Time, capital, and risk tolerance
Start with five numbers.
Write them down before choosing anything.
Available trading hours per day. Not total free time, but focused hours during liquid market sessions. If you can only check charts at 7 a.m. and 9 p.m., intraday styles are effectively off the table.
Account size. Small accounts struggle with position trading’s tied-up capital and with day trading’s margin rules. A $3,000 account risking 1% per trade can only lose $30 per position, which forces either tight stops or very small size.
Maximum acceptable drawdown. If a 15% decline would make you abandon the plan, choose a style and sizing where that’s statistically unlikely. Your risk-reward ratio and win rate together determine how deep losing streaks get.
Transaction costs and execution quality. Commission per side, typical spread, and average slippage on your broker. These numbers matter far more to a scalper making 40 trades a day than to a swing trader making 4 a month.
Here’s the uncomfortable truth: faster styles don’t automatically produce higher returns. Research by Barber, Lee, Liu, and Odean on Taiwanese day traders found that fewer than 1% were able to predictably profit net of fees.
More trades means more costs, more decisions, and more chances to make mistakes.
Which markets suit which style
The market you trade shapes which style is practical. Liquidity hours, overnight financing, and available leverage vary widely.
Forex runs 24 hours a day, five days a week, with the deepest liquidity during the London and New York overlap (roughly 8 a.m. to 12 p.m. ET). Tight major-pair spreads suit scalping and day trading, while nightly swap costs penalize long swing holds on negative-carry pairs.
U.S. stocks concentrate liquidity in the 9:30 a.m. to 4:00 p.m. ET session. Gaps happen overnight, and earnings season creates scheduled volatility, which makes stocks natural for swing and position trading built around catalysts.
Futures trade nearly 23 hours on CME Globex, offer high leverage, and use standardized contracts that suit disciplined day traders.
Options add time decay, which punishes slow position trades in short-dated contracts.
Crypto trades 24/7 with high market volatility and leverage up to 100x on some offshore venues, a recipe for fast liquidation.
Twenty-four-hour markets change the screen-time math. A forex or crypto scalper can trade a liquid window at a time that fits their schedule.
But a swing trader in crypto has no closing bell and no weekend break, so stop placement and alerts must handle moves at 3 a.m. on a Sunday.
Strategies, indicators, and timeframe context
Every indicator on your chart is a rearrangement of past price or volume.
None of them knows what happens next.
That single fact explains why the same signal can win in one market and lose badly in another.
Momentum, breakout, and mean-reversion strategies
Each strategy depends on a market regime. Momentum and trend-following strategies thrive when price trends cleanly, and they bleed through repeated small losses in choppy ranges.
Breakout strategies need a real expansion in volatility; in quiet markets, most breakouts fail and reverse.
Mean reversion is the opposite.
It profits in ranges and gets crushed when a strong trend keeps “overextending.” So when you evaluate any indicator, ask three questions: How much does it lag? How often does it give false signals? And in which regime was it tested?
A 50-period moving average crossover might show a positive expectancy in a trending 2023 sample and a negative one in a ranging 2025 sample.
The indicator didn’t break.
The regime changed.
Why the same indicator reads differently by timeframe
Picture a stock in a clear daily uptrend, trading above its rising 50-day moving average. On the 5-minute chart, it’s pulling back, RSI is at 28, and price just crossed below the 20-period average.
Is it bullish or bearish?
Both… depending on the trading timeframe you’re asking about.
The 5-minute chart describes the last two hours. The daily chart describes the last two months.
Neither is wrong, but trading the short-term sell signal against the long-term trend means fighting the larger flow of orders.
This is where many intraday traders lose money without understanding why.
They take every lower-timeframe signal at face value, ignoring which direction the bigger picture favors.
Confirming signals across timeframes
Multi-timeframe analysis solves this by assigning each timeframe a job.
The higher timeframe sets direction. The lower timeframe times the entry.
A swing trader might use the daily chart for trend and the 1-hour chart for entries; a day trader might use the 1-hour for bias and the 5-minute for execution.
The common mistake is stacking more indicators instead of more context. Adding RSI, MACD, and stochastics to the same chart mostly repeats the same price information three times.
When they contradict each other, traders cherry-pick the one that agrees with what they already wanted to do.
A more disciplined approach separates the signal from the entry level. PipTrend’s setup is a practical example.
Its 12-timeframe confirmation table shows whether trend direction agrees from the 1-minute chart up through the higher timeframes, so you can see at a glance whether a lower-timeframe signal lines up with the broader picture or works against it.
Entries are then anchored to objective price levels rather than the indicator itself: session highs and lows, VWAP, and supply and demand zones.
The signal says “conditions favor longs.” The level says “this is where the risk is defined.”
An indicator tells you about conditions. A price level tells you where you’re wrong. Good trades need both.
Frequently asked questions
What are the 5 types of trading?
The five most commonly listed types are scalping, day trading, swing trading, position trading, and algorithmic trading. The first four are styles defined by holding period.
Algorithmic trading is an execution method that can run any of those styles automatically.
Which type of trading is most profitable?
No type of trading is inherently the most profitable.
Profitability depends on trade expectancy after spreads, commissions, slippage, and financing costs, not on trade speed or win rate alone. A swing strategy winning 40% of trades at a 3:1 risk-reward ratio can outperform a scalping system that wins 70% but pays heavy costs on every trade.
What is the easiest type of trading for beginners?
Swing trading is usually the easiest starting point for beginners. It requires 30 to 90 minutes of screen time per day, gives time to plan each trade, and makes transaction costs a small share of each target.
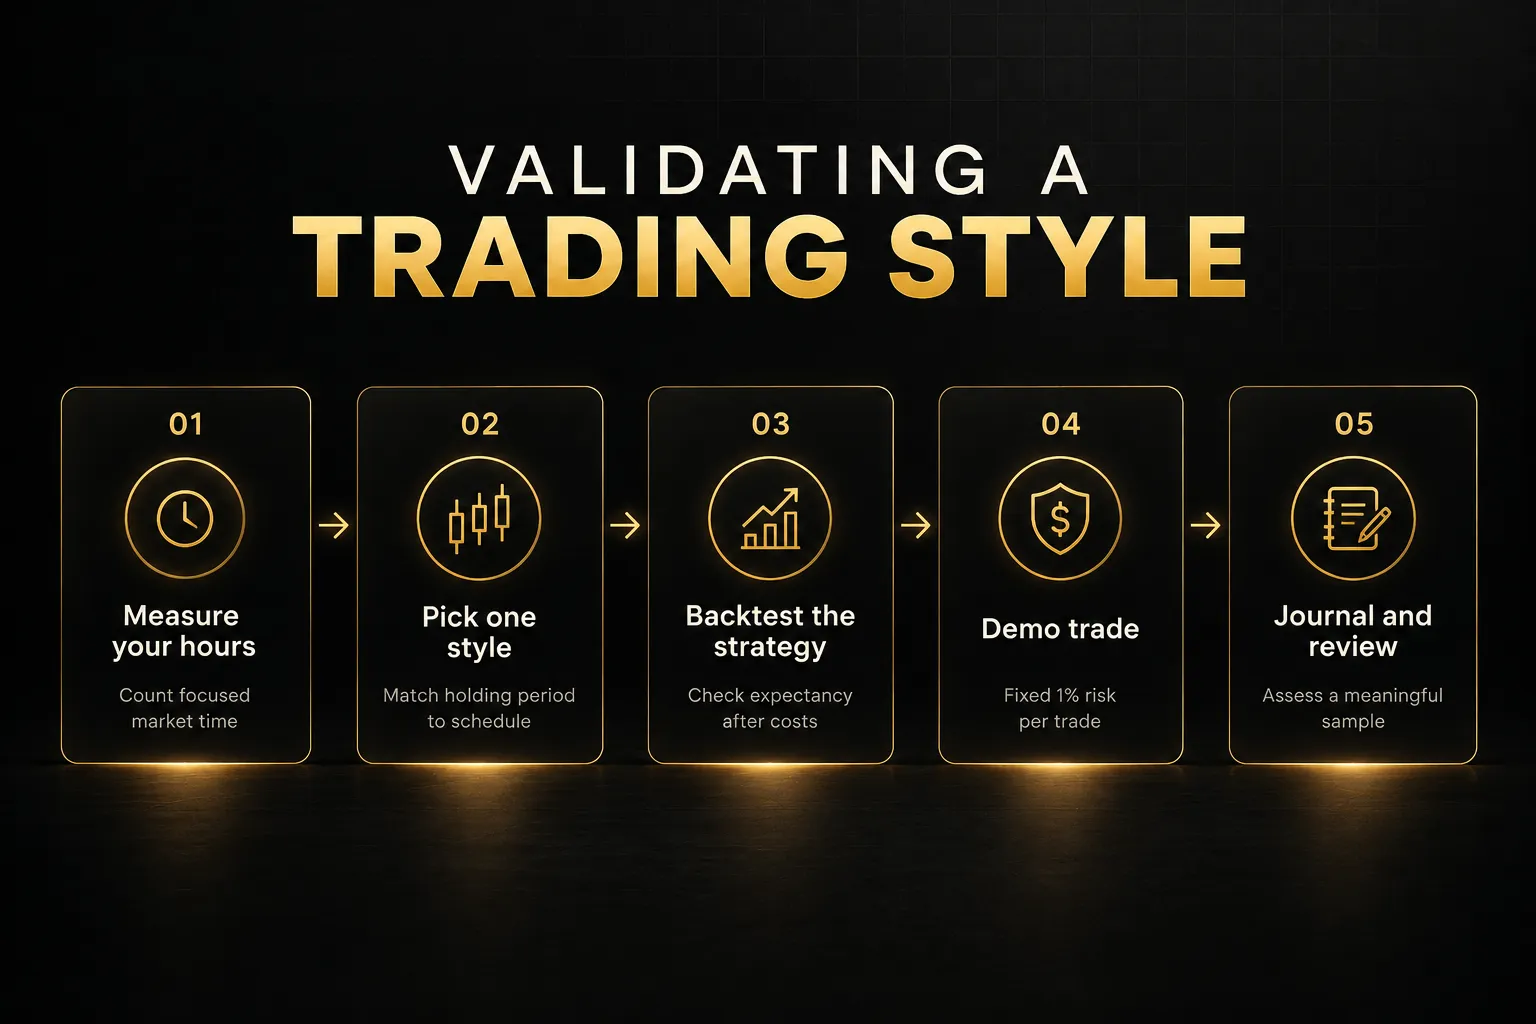
Beginners should still paper trade, backtest, and forward test while keeping a trading journal of at least 50 to 100 trades before going live.
What is the difference between day trading and swing trading?
Day trading closes every position within the same session, while swing trading holds positions for several days to a few weeks.
Day traders avoid overnight gap risk but face intense intraday volatility and higher cumulative costs. Swing traders spend less time at the screen but accept gaps, earnings surprises, and overnight financing charges.
Is scalping better than swing trading?
Scalping is not better than swing trading; it’s more demanding.
Scalping requires low-cost execution, deep liquidity, fast reactions, and a statistically proven edge, because costs can consume 20 to 50% of each target. Swing trading tolerates slower execution and fits more schedules, which is why more retail traders sustain it over time.
What type of trading is best for part-time traders?
Swing trading and position trading are the best fits for part-time traders. Both styles can be managed with end-of-day analysis, pre-set limit orders, and stop-loss orders placed in advance.
Part-time traders in 24-hour markets like forex can also day trade a single liquid session, such as the London and New York overlap, if it matches their free hours.
Pick the style that fits your life, not your impulses
Most traders choose a style because it looks exciting. The ones who last choose it because it fits their week.
Here’s a clear decision rule.
If you have limited screen time and a lower tolerance for rapid losses, start with swing or position trading. If you can watch markets full time during liquid hours, have tight execution costs, and accept fast-moving risk, day trading or scalping becomes viable.
Whatever you pick, test it before funding it. Run the style on a demo account with a fixed risk-per-trade rule (1% of account equity is a common ceiling), log every trade, and review your expectancy after a meaningful sample.
If the numbers don’t hold up in simulation, they won’t improve with real money and real emotions.
And remember the bigger point behind every type of trading explained here. The “best” style isn’t the fastest one or the one with the flashiest screenshots.
It’s the one whose costs, time demands, and risk match the life you actually live.
Sources
Risk Disclaimer: Trading involves risk. Past performance doesn't guarantee future results. Only trade with money you can afford to lose. PipTrend is a tool to assist your trading decisions, not financial advice.