
In 2026, advanced price analysis tools are transforming how traders engage with fast-moving markets. The surge in algorithmic and AI-driven trading has made mastering vwap more essential than ever.
This guide will break down vwap, revealing how it brings precision and consistency to your trading decisions. You will discover what vwap is, why it matters, how to calculate it, and learn practical strategies for success.
Expect actionable insights, real-world examples, and advanced techniques to help you excel. Ready to leverage vwap for smarter, more profitable trades? Let’s get started.
Understanding VWAP: Definition, History, and Core Concepts
The vwap, or Volume Weighted Average Price, serves as a foundational benchmark in modern trading. It represents the average price of a security throughout a specific period, weighted by the amount of trading volume at each price point. Unlike simple averages, vwap reflects where most trading activity occurs, making it crucial for traders who want a true sense of market value.
Vwap first gained traction in the 1980s as institutional investors sought better ways to measure trade execution quality. Over time, its adoption expanded from large funds and banks to retail traders, thanks to the rise of electronic trading platforms. Today, vwap is widely used by more than 2.8 million finance professionals globally, highlighting its importance across the trading landscape.
Comparing vwap to other moving averages offers clear insights. While a Simple Moving Average (SMA) calculates the mean of closing prices over a set period, and a Weighted Moving Average (WMA) gives more emphasis to recent prices, vwap uniquely incorporates trading volume at each price. This means vwap adapts in real time to both price movement and liquidity, providing a more objective view of fair value.
| Feature | VWAP | SMA | WMA |
|---|---|---|---|
| Uses Volume | Yes | No | No |
| Weights Recent Data | Yes (by volume) | No | Yes (by recency) |
| Real-Time Adaptation | Yes | Limited | Limited |
| Common Use | Institutional, Retail | General | Specialized |
Why does vwap matter so much? For one, it is a powerful tool for price discovery. Traders often compare their trade prices to vwap to assess execution quality. Institutions use it to benchmark performance and minimize market impact, while retail traders look for vwap crossovers as entry or exit signals. Its objectivity and sensitivity to volume make it an essential component of market efficiency.
The core components of vwap are price, volume, and timeframe. To calculate vwap, you multiply the typical price for each interval by the volume, sum these products, and then divide by the total cumulative volume. Here’s a simple example:
# Example VWAP calculation
intervals = [
 {'price': 102, 'volume': 200},
 {'price': 104, 'volume': 150},
 {'price': 101, 'volume': 250}
]
cumulative_pv = sum([i['price'] * i['volume'] for i in intervals])
cumulative_vol = sum([i['volume'] for i in intervals])
vwap = cumulative_pv / cumulative_vol
print(f"VWAP: {vwap:.2f}")
This calculation highlights how vwap captures both price and trading intensity. For those seeking to deepen their practical understanding, exploring VWAP indicator strategies can provide actionable techniques tailored for various market environments.
Ultimately, the vwap’s objectivity and responsiveness to real trading activity make it a preferred indicator for both day traders and institutions. Its widespread adoption, unique calculation, and role in price discovery ensure that vwap remains a cornerstone of effective trading strategies.
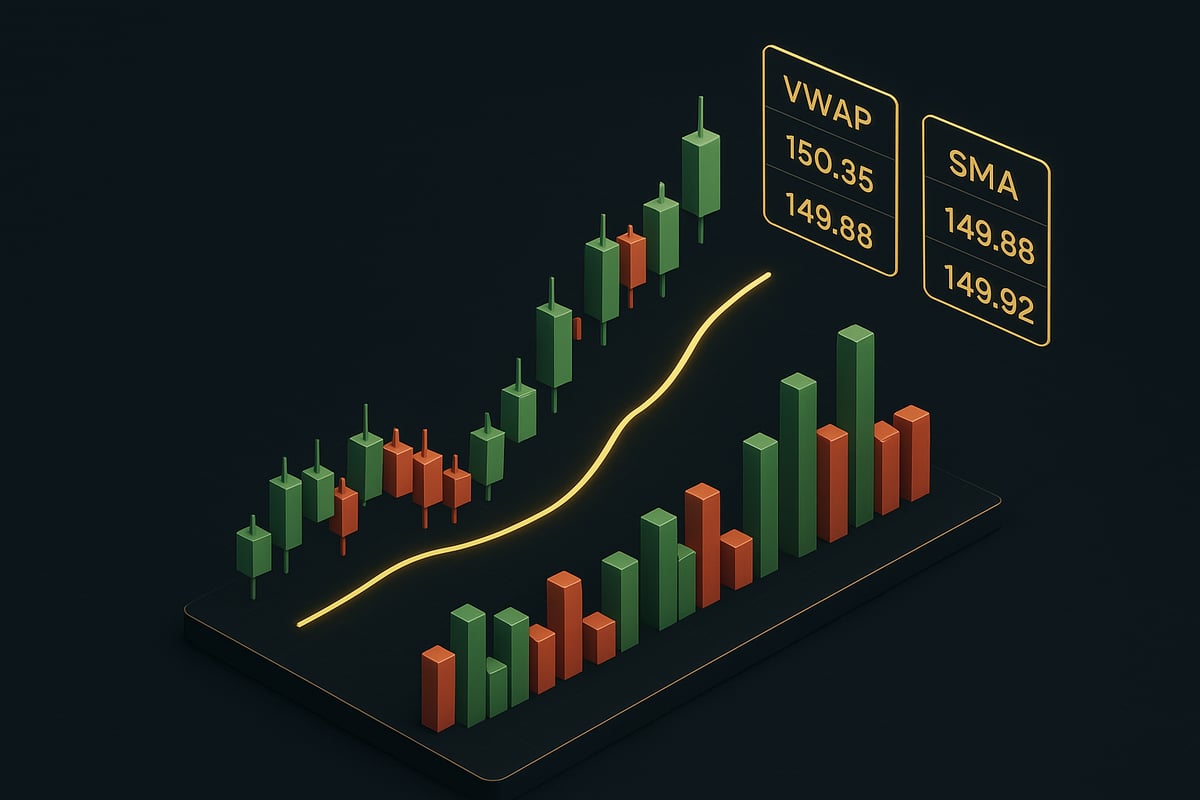
Calculating VWAP: Step-by-Step Guide for 2026
Understanding how to calculate vwap is essential for any trader aiming to harness its full potential. In this guide, we break down the process, ensuring you gain both theoretical insight and practical skills to apply vwap confidently in your trading routine.
The VWAP Formula Explained
The vwap formula is straightforward yet powerful:
VWAP = (Cumulative Price x Volume) / Cumulative Volume
Let us break down each component:
- Price: Typically, the average price per interval, calculated as (High + Low + Close) / 3.
- Volume: The number of shares or contracts traded during each interval.
- Cumulative Totals: As the trading session progresses, both price-volume products and volumes are summed up.
For example, suppose a stock has the following intraday data:
| Interval | High | Low | Close | Volume | Typical Price | Price x Volume |
|---|---|---|---|---|---|---|
| 09:30 | 100 | 98 | 99 | 500 | 99 | 49,500 |
| 09:31 | 100.5 | 99 | 100 | 600 | 99.83 | 59,898 |
To calculate vwap at 09:31:
- Cumulative Price x Volume = 49,500 + 59,898 = 109,398
- Cumulative Volume = 500 + 600 = 1,100
- VWAP = 109,398 / 1,100 = 99.45
Vwap can be calculated in real time or at the end of the trading day. Modern trading platforms automate this calculation, but understanding the mechanics ensures you interpret vwap signals accurately.
Chronological Steps to Calculate VWAP
Calculating vwap manually reinforces your grasp of this indicator. Here is a step-by-step process:
Step 1: Gather intraday price and volume data for each interval (e.g., every 1 or 5 minutes).
Step 2: For each interval, compute the typical price:
typical_price = (high + low + close) / 3
Step 3: Multiply the typical price by the volume for that interval.
Step 4: Continuously sum the price-volume products and the total volume as the session progresses.
Step 5: At each point, divide the cumulative price-volume total by the cumulative volume:
vwap = cumulative_price_volume / cumulative_volume
Step 6: Plot vwap on your trading chart for visual reference.
Here is an illustrative table:
| Time | Typical Price | Volume | Cum. Price x Volume | Cum. Volume | VWAP |
|---|---|---|---|---|---|
| 09:30 | 99 | 500 | 49,500 | 500 | 99.00 |
| 09:31 | 99.83 | 600 | 109,398 | 1,100 | 99.45 |
Manual calculation is valuable, especially when you want to validate automated vwap outputs or analyze historical data. Practicing these steps helps you internalize how vwap responds to changes in price and volume, giving you an edge in fast-moving markets.
Tools and Platforms for VWAP Calculation
Most modern trading platforms simplify vwap calculation with built-in tools. Popular platforms like MetaTrader, TradingView, and Bloomberg Terminal offer real-time vwap overlays, allowing traders to focus on analysis rather than manual computation.
Advanced users can deploy API scripts or custom code to calculate vwap for unique data sets. Mobile and web-based applications also support vwap tracking, ensuring accessibility on the go.
Comparing vwap values across platforms can reveal slight differences due to data feeds or calculation intervals. For those seeking a comprehensive understanding of vwap and how it fits among other technical tools, the Trading indicators guide offers valuable context.
Ultimately, the accessibility of vwap across platforms empowers traders at every level to make data-driven decisions.
Why VWAP Matters: Benefits, Use Cases, and Limitations
Navigating fast-moving markets requires more than intuition. Traders and institutions need reliable tools to benchmark trades, identify opportunity, and manage risk. The vwap indicator stands out as a trusted metric for achieving these goals. By evaluating price through the lens of volume, vwap provides a transparent and objective view of market activity that is difficult to manipulate or misinterpret.
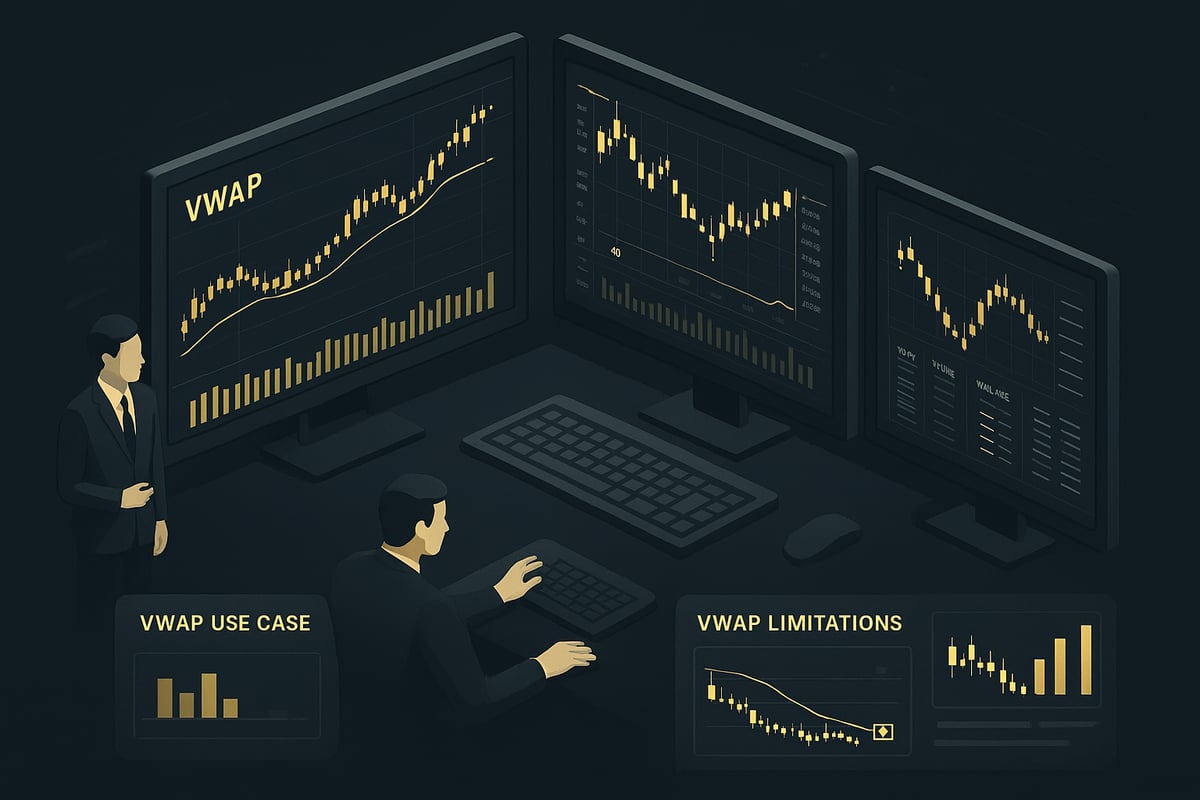
Strategic Benefits of Using VWAP
The vwap indicator offers several strategic advantages for both individual and institutional traders. One of its primary benefits is objective trade benchmarking. By comparing execution prices to vwap, traders can immediately assess whether a trade was executed at a favorable price relative to overall market activity.
VWAP also highlights fair value zones, helping traders pinpoint optimal entry and exit points. For large orders, executing near vwap minimizes market impact, reducing slippage and maintaining price stability. Institutions rely on vwap to document transparency and compliance, ensuring trades align with best execution standards.
Consider the following summary of vwap’s core benefits:
| Benefit | Description |
|---|---|
| Benchmarking | Compare trade price to vwap |
| Fair Value Identification | Spot optimal buy/sell zones |
| Market Impact Reduction | Minimize slippage on large trades |
| Compliance & Transparency | Meet institutional standards |
These features make vwap indispensable for trading strategies where precision and accountability are essential.
Common Use Cases for VWAP
VWAP’s versatility is reflected in its wide range of practical applications. In intraday trading, vwap acts as a dynamic reference point. Traders watch for price crossing above vwap to signal bullish momentum or below vwap for bearish sentiment. These signals help refine entries and exits with greater accuracy.
Algorithmic trading systems frequently use vwap as a benchmark to optimize execution, ensuring trades are distributed throughout the day to avoid moving the market. Portfolio managers utilize vwap for rebalancing and executing large block trades, seeking to achieve an average price close to vwap for performance consistency.
Regulatory frameworks often require institutions to demonstrate best execution practices. Using vwap as a reporting metric helps ensure compliance and provides transparency for stakeholders.
A notable example involves a hedge fund deploying a vwap-based execution strategy. By breaking up large orders and targeting executions near vwap, the fund consistently reduced transaction costs and mitigated adverse price movement. For an in-depth analysis of vwap’s effectiveness in real trading environments, see VWAP: The Holy Grail for Day Trading Systems.
VWAP’s adaptability across different trading styles and asset classes cements its reputation as a cornerstone indicator for modern market participants.
Limitations and Pitfalls of VWAP
Despite its strengths, vwap is not without limitations. One key challenge is lag, especially in volatile or illiquid markets where price and volume can shift rapidly. This lag means vwap may not always reflect the most current market sentiment, potentially resulting in suboptimal trade decisions.
VWAP is also less effective for certain asset classes or extended timeframes, such as overnight sessions or low-volume periods. In these scenarios, reliance on vwap alone can generate misleading signals. Over-trading based solely on minor deviations from vwap may lead to unnecessary losses.
To mitigate these pitfalls, traders should always use vwap in conjunction with other indicators and confirm signals with price action or volume analysis. Combining tools ensures a well-rounded approach and helps avoid common mistakes associated with vwap over-reliance.
Mastering VWAP Strategies: Practical Applications for Traders
Unlocking the full potential of vwap requires mastering a set of adaptable strategies. Traders across all experience levels can leverage vwap to refine their entries, exits, and risk management in fast-moving markets. Let us explore the most effective ways to apply vwap in your daily trading routine.
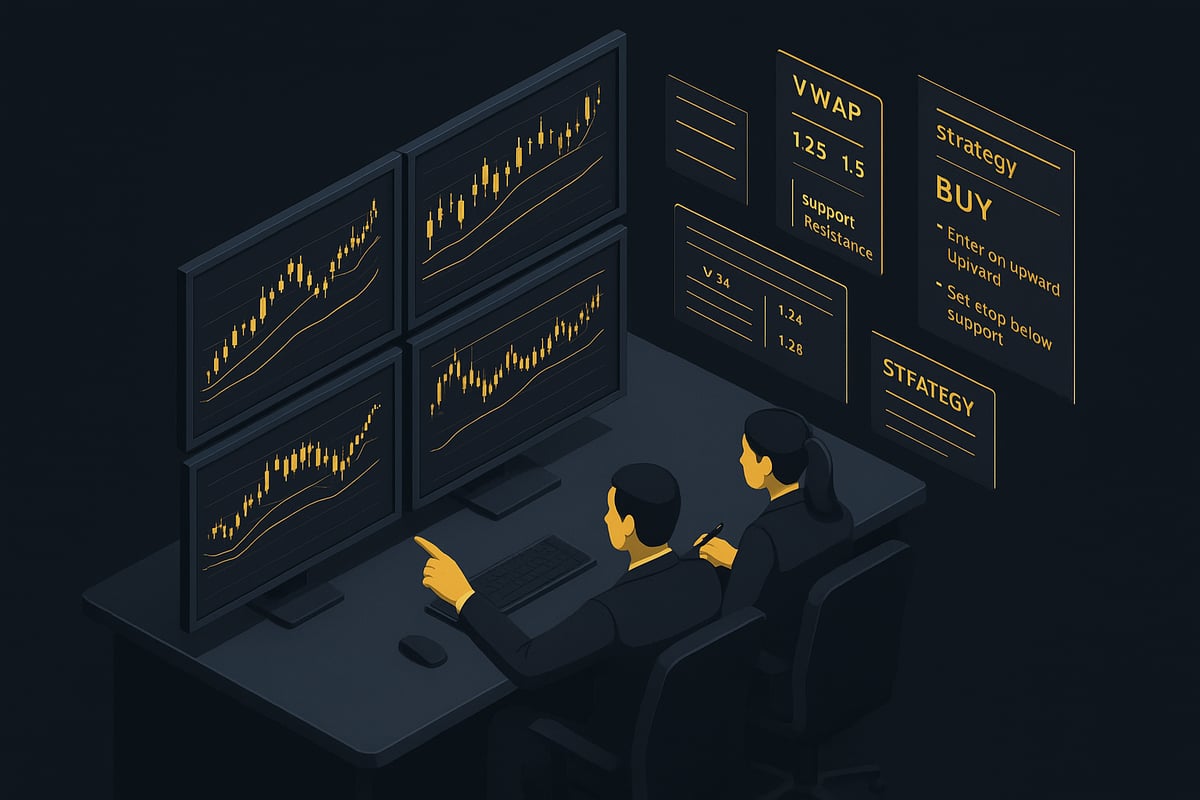
VWAP as Support and Resistance
Vwap is not just a technical indicator, it is a dynamic reference point for price action. Unlike static support and resistance levels, vwap adapts in real time to volume and price shifts. When price approaches the vwap line, it often acts as a magnet, drawing price toward it or causing a bounce.
For example, if a stock rallies above vwap and then retraces, vwap commonly provides support. Conversely, when price falls below vwap, it may serve as resistance. This fluid behavior allows traders to identify potential reversal or continuation zones.
Consider the following scenario: A security trades above vwap for most of the morning session. As price dips toward vwap, buyers step in, confirming support. If price breaks below vwap on high volume, it signals a possible trend reversal. The adaptability of vwap in volatile intraday environments makes it an essential tool for traders seeking to react to market dynamics.
VWAP Cross Strategies for Entry and Exit
One of the most popular vwap strategies is the vwap cross. When price crosses above vwap, it often suggests bullish momentum, while a cross below indicates bearish sentiment. Traders use these signals to time their entries and exits efficiently.
To enhance reliability, many combine vwap crosses with volume confirmation. For instance, a long position is favored when price moves above vwap with rising volume, while a short position is considered when price drops below vwap and volume surges.
Backtesting vwap cross strategies in equities or forex markets reveals that layering vwap with indicators like RSI or MACD can filter out false signals. This multi-indicator approach increases accuracy and helps traders avoid whipsaws. The vwap cross method offers a straightforward yet powerful framework for both day traders and swing traders.
VWAP Bands and Envelope Approaches
Vwap bands, or envelopes, expand the utility of vwap by adding upper and lower boundaries—typically set at one standard deviation above and below the central vwap line. These bands help traders spot overbought or oversold conditions within the trading session.
For example, when price touches the upper vwap band, it may signal overextension, prompting traders to look for a reversal or profit-taking opportunity. Similarly, a move to the lower band can indicate oversold territory and a potential bounce.
A common vwap band strategy is to wait for price to reach an extreme band, then enter a trade in the opposite direction with a stop near the band. This approach adds context to simple vwap readings and helps manage risk in volatile markets. By using vwap bands, traders gain a more nuanced perspective on intraday price action.
Multi-Timeframe VWAP Analysis
Applying vwap across multiple timeframes allows traders to align short-term decisions with broader market trends. For instance, using vwap on daily, weekly, and monthly charts helps identify major support and resistance zones that intraday traders might otherwise miss.
A practical approach is to confirm intraday trades with higher timeframe vwap trends. If the daily vwap slopes upward and price remains above both intraday and daily vwap, it signals a strong bullish environment. Conversely, conflicting vwap trends may prompt caution or reduced position sizes.
For those seeking to deepen their understanding of multi-timeframe vwap methods, exploring resources like Multi-timeframe trading techniques can offer actionable insights. Integrating multi-timeframe vwap into your playbook reduces noise and false signals, providing a robust edge in any market condition.
Advanced VWAP Techniques and Innovations for 2026
As markets evolve, mastering advanced vwap techniques is essential for traders seeking an edge in 2026. From AI-powered execution to cross-market adaptability, vwap is at the center of innovation for systematic and discretionary traders alike. Let’s explore how these cutting-edge approaches can transform your trading strategies.
Algorithmic and AI-Driven VWAP Execution
Algorithmic trading has revolutionized how vwap is used in the real world. Today, traders rely on advanced algorithms to execute large orders with minimal market impact, targeting the vwap as a benchmark for optimal price. These systems adapt to real-time liquidity, volatility, and order book shifts, continually refining execution logic.
AI is now elevating vwap strategies even further. Machine learning models analyze historical and intraday data, adjusting vwap parameters in real time to respond to shifting market conditions. For example, AI-driven bots can dynamically alter execution speed based on detected volume spikes or unusual order flow, ensuring trades align closely with the desired vwap.
If you want a deeper dive into how AI and automation are reshaping vwap execution, check out this overview of Algorithmic trading and AI. For a comprehensive analysis of the latest developments and limitations in vwap algorithms, see this Review of VWAP Trading Algorithms.
By leveraging these technologies, traders can achieve greater consistency and precision when executing complex vwap-based strategies.
VWAP in High-Frequency and Institutional Trading
In high-frequency trading (HFT), vwap serves as a crucial reference point for order slicing and execution timing. HFT firms often deploy microsecond-level algorithms that aim to execute large orders while minimizing slippage from the prevailing vwap. This approach helps them avoid moving the market excessively, which is vital for profitability.
Institutional traders also depend on vwap to benchmark trade performance and demonstrate best execution. By breaking down large trades into smaller increments, institutions can match or outperform the market’s vwap, ensuring transparency and compliance. Many global asset managers measure their execution quality by comparing it to vwap, making it a standard in professional trading environments.
A notable example is when a pension fund needs to liquidate a significant position. By using vwap as a target, the fund can spread its trades throughout the day, reducing market impact and achieving a fair average price. This methodology underscores why vwap remains indispensable for institutions and HFT players.
Integrating VWAP with Other Indicators and Order Flow
While vwap is powerful on its own, it becomes even more effective when combined with other market indicators and order flow data. Many traders pair vwap with volume profiles to identify high-activity price zones, giving context to where the bulk of trading occurs. Adding momentum indicators, such as RSI or MACD, can further refine entry and exit points.
For example, a trader might look for confluence between a vwap bounce and support level from a volume profile. If both indicators align, it signals a stronger trade setup. Similarly, monitoring order book imbalances alongside vwap can help anticipate short-term reversals or breakouts.
In practice, integrating vwap with these tools boosts confidence and reduces false signals. This layered approach is especially useful in fast-moving markets, where relying solely on vwap may not provide the full picture. Experimenting with different combinations can help traders uncover new edges in their strategies.
VWAP in Non-Equity Markets: Crypto, Forex, and Beyond
Vwap is no longer just for equities. Its adaptability makes it valuable in markets like cryptocurrencies, forex, and commodities, each with unique challenges. Crypto and forex operate 24/7, so traders must adjust vwap calculations to account for extended trading hours and variable liquidity.
For instance, applying vwap to BTC/USD or EUR/USD requires careful attention to the rolling nature of these markets. Spikes in volume during specific sessions, or sudden liquidity drops, can distort vwap readings if not managed properly. Traders often use session-specific vwap or custom timeframes to address these challenges.
Despite these hurdles, vwap provides a reliable gauge of fair value across asset classes. Its ability to adapt to different markets makes it a versatile tool for both discretionary and systematic traders. As adoption grows in crypto and forex, expect to see even more innovative vwap applications in the years ahead.
Avoiding Common VWAP Mistakes: Best Practices for 2026
Mastering vwap requires more than knowing the formula. Even experienced traders can fall into common traps that undermine results. By understanding these pitfalls, you can transform vwap from a basic tool into a strategic advantage.
Common VWAP Pitfalls in Modern Trading
One frequent mistake is relying on vwap during periods of low liquidity or after regular trading hours. In these times, price and volume data can be distorted, causing the vwap to misrepresent true fair value. This may lead to false signals and poor trade entries.
Another issue is overtrading based on minor deviations from vwap. Small price movements above or below vwap do not always indicate actionable opportunities. Chasing every crossover or bounce can quickly erode profits through fees and slippage.
Ignoring Market Context and Calculation Adjustments
Some traders overlook the importance of broader market context. News releases, earnings reports, or macroeconomic shifts can all impact how vwap should be interpreted. Failing to adjust your vwap calculations for different market sessions, such as pre-market or post-market, often leads to inaccurate benchmarks.
Consider this example: A trader executed a large order just after a major earnings announcement, trusting the standard vwap line. The sudden surge in volume and price volatility skewed the vwap, resulting in a trade far from the optimal entry point. This highlights the danger of ignoring context and session-specific adjustments.
Table: VWAP Mistakes and Solutions
| Mistake | Consequence | Solution |
|---|---|---|
| Using vwap in low liquidity | False signals | Trade during high-volume sessions |
| Overtrading on minor vwap deviations | Increased costs | Wait for strong, confirmed signals |
| Ignoring news or macro events | Missed context | Always check market calendar |
| Not adjusting for session changes | Inaccurate vwap readings | Recalculate vwap for each session |
Best Practices for VWAP Success in 2026
To maximize the reliability of vwap, always confirm its signals with price action and volume. Avoid tunnel vision; combine vwap with other technical indicators and stay aware of market news.
Developing discipline is crucial. Use trading journals and backtesting to review your vwap-based strategies over time. This helps you spot patterns in mistakes and successes. Continuous learning is vital as vwap innovations evolve rapidly. For those seeking to refine their approach, the Optimal VWAP Trading Strategy offers deeper insights into advanced methods.
Ultimately, treating vwap as part of a broader toolkit, rather than a standalone solution, leads to more consistent and profitable decision-making.
After exploring the many ways VWAP can sharpen your trading strategy and help you stay ahead in today’s fast-moving markets, why not take the next step? With PipTrend, you gain access to AI-powered, real-time signals and multi-timeframe VWAP analysis—making it easier to put these techniques into practice. You deserve tools that remove the guesswork and let you focus on making informed, confident trades. Ready to see a difference in your results? See Your Trading Improve With PipTrend and start applying what you’ve learned right away.