
In 2025’s fast-paced markets, traders are constantly searching for that competitive edge—fibonacci retracement remains a cornerstone of technical analysis, trusted by professionals and beginners alike.
This comprehensive guide demystifies fibonacci retracement, revealing its origins, calculation process, and real-world applications. You'll learn proven strategies, advanced techniques tailored for today’s markets, and common pitfalls to avoid.
Discover why mastering this classic tool is more crucial than ever. Get ready to gain clarity, boost your trading confidence, and make smarter decisions with fibonacci retracement at your side.
Understanding Fibonacci Retracement: Origins, Theory, and Key Levels
Fibonacci retracement is much more than just a technical buzzword—it’s rooted in centuries-old mathematics that continues to shape how traders analyze today’s markets. To truly appreciate its power, let’s explore its origins, the logic behind its key levels, and why it has become a psychological anchor for so many.
The Fibonacci Sequence and Its Financial Significance
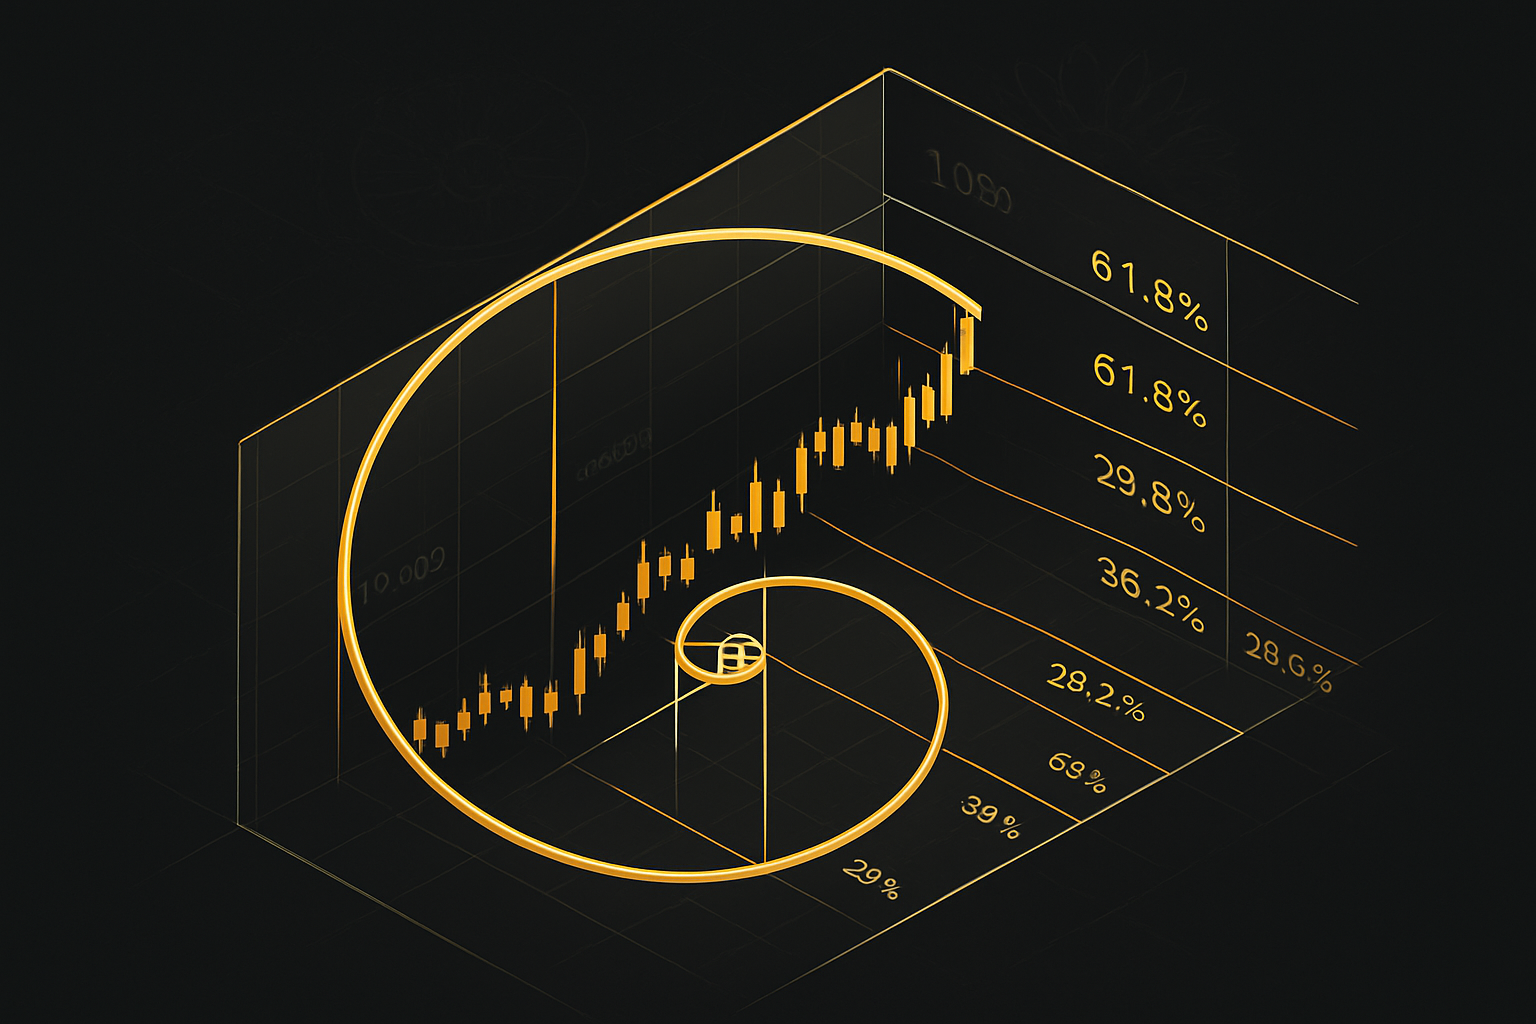
The story of fibonacci retracement begins with the Fibonacci sequence—a simple series where each number is the sum of the two preceding ones (0, 1, 1, 2, 3, 5, 8, 13, and so on). Leonardo Fibonacci introduced this sequence to the Western world in the 13th century, but its influence reaches far beyond mathematics.
What makes fibonacci retracement so intriguing for traders are the ratios derived from this sequence. By dividing one number by the next (e.g., 21/34), you get approximately 0.618, known as the "golden ratio." This value—along with 0.236, 0.382, 0.500, and 1.000—forms the backbone of fibonacci retracement levels.
These ratios aren’t just mathematical curiosities. They appear in nature, architecture, and even art. For instance:
- Sunflowers: The seeds spiral out in patterns that reflect Fibonacci numbers.
- Seashells: Their curves often match the golden ratio.
- Galaxies: Spiral arms follow Fibonacci proportions.
Traders draw an analogy between these natural patterns and market movements, believing that crowd psychology often causes prices to react at specific fibonacci retracement levels.
| Fibonacci Level | Ratio | Psychological Meaning |
|---|---|---|
| 23.6% | 0.236 | Shallow correction |
| 38.2% | 0.382 | Moderate pullback |
| 50.0% | 0.500 | Key psychological midpoint |
| 61.8% | 0.618 | Deep retracement/"golden" |
| 100% | 1.000 | Full retracement |
These levels are so embedded in trading platforms that they’re almost universal. According to Strategies for Trading Fibonacci Retracements, traders worldwide rely on these ratios to identify crucial support and resistance zones.
Why do these levels matter? Much of it boils down to psychology. When enough traders expect a reversal or bounce at a fibonacci retracement line, their collective actions often make it a reality.
How Fibonacci Retracement Works in Technical Analysis
Fibonacci retracement is all about measuring how far a price moves against a prevailing trend. But it’s crucial to understand the difference between a retracement (a temporary pullback) and a reversal (a complete change in trend direction).
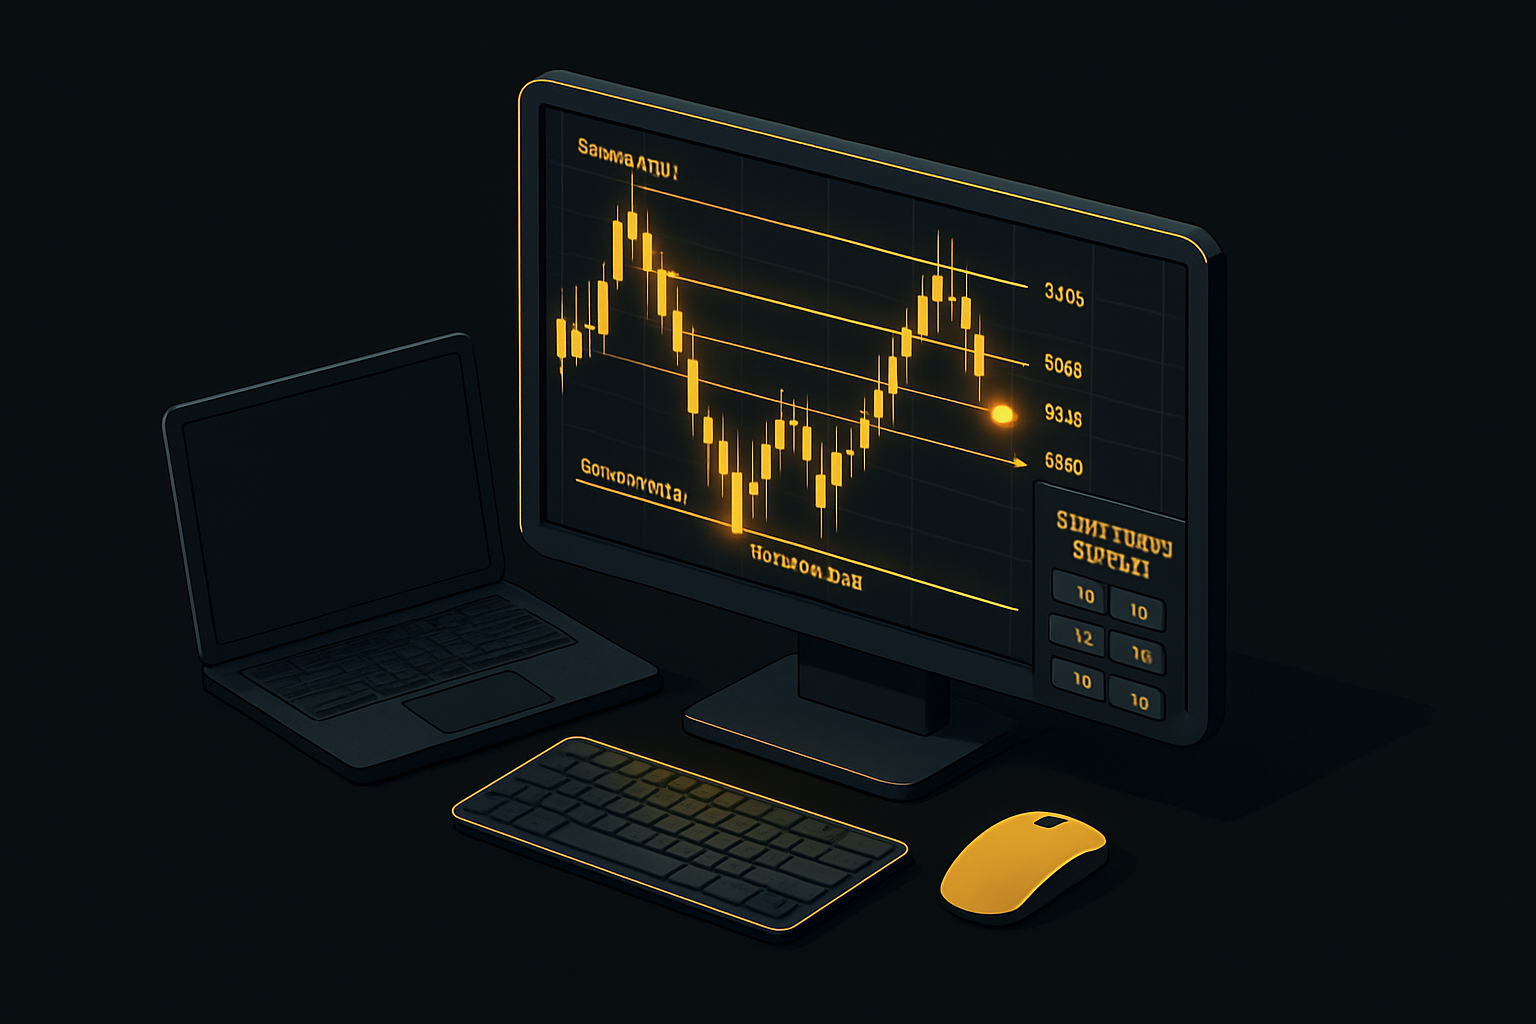
To use fibonacci retracement, traders identify a clear swing high and swing low on a price chart. By drawing horizontal lines at key fibonacci retracement levels, they create a visual map of possible support and resistance.
Unlike moving averages, which shift as new data comes in, fibonacci retracement levels are static—they stay fixed until a new price swing is measured. This makes them especially useful for planning entry and exit points.
Consider this example: In 2023, the USD/CAD currency pair experienced a sharp rally, then pulled back to the 38.2% fibonacci retracement level before resuming its trend. This scenario is common, as many traders monitor fibonacci retracement for similar reactions.
Some critics argue that the effectiveness of fibonacci retracement is statistically debatable. Yet, the tool remains widely used. This popularity creates a self-fulfilling prophecy—when enough traders act on fibonacci retracement signals, price often reacts accordingly.
Ultimately, fibonacci retracement serves as a trusted map for navigating unpredictable markets, blending mathematical logic with human psychology.
Step-by-Step: How to Draw and Use Fibonacci Retracement in 2025
Whether you’re a beginner or a seasoned trader, mastering the step-by-step process of using fibonacci retracement can bring structure and clarity to your market analysis. In 2025, with markets moving faster than ever, knowing how to properly draw and interpret these levels is a must. Let’s break down the modern workflow, from choosing the right chart to making trade decisions.
Choosing the Right Chart and Timeframe
Selecting the ideal chart and timeframe is the foundation of effective fibonacci retracement analysis. Not all assets or market environments are equally suited for this tool, so context matters.
First, consider the asset class. Fibonacci retracement is widely used in forex, stocks, cryptocurrencies, and indices. Each market has unique volatility and liquidity characteristics. For instance, forex pairs often respect retracement levels during strong trends, while highly volatile crypto assets may require broader zones for analysis.
Next, pick the best timeframe for your trading style. Intraday traders might work with 5-minute or 15-minute charts, while swing traders favor 4-hour or daily timeframes. Position traders usually analyze weekly or even monthly charts. The key is to match your analysis window to your trade horizon.
Market context is crucial. Fibonacci retracement works best in trending markets where price moves clearly from swing lows to swing highs (or vice versa). Avoid applying it in low-volatility, choppy, or sideways markets, as false signals are more common.
A common mistake is ignoring the bigger picture. Multi-timeframe analysis is now standard in 2025, allowing traders to spot major support and resistance zones across several chart intervals. For a deeper dive, check out multi-timeframe analysis in trading to see how it amplifies fibonacci retracement accuracy.
When to avoid fibonacci retracement:
- Flat, range-bound markets with no clear trend
- Illiquid assets prone to erratic price spikes
- Timeframes with excessive noise or too few data points
By carefully matching your chart and timeframe to the asset and current market phase, you set the stage for meaningful fibonacci retracement insights.
Plotting Fibonacci Retracement Levels: Chronological Guide
Once you’ve chosen your asset and timeframe, it’s time to plot the fibonacci retracement levels. Here’s a step-by-step guide to ensure accuracy and consistency:
Step 1: Identify the swing high and swing low.
Locate the most recent significant peak (swing high) and trough (swing low) on your chart. These anchor points define the price move you want to analyze.
Step 2: Select the fibonacci retracement tool.
Most trading platforms, from MetaTrader to TradingView, offer a built-in fibonacci retracement feature. Activate it from your chart’s drawing tools.
Step 3: Anchor from start to end.
Click at the swing low (for an uptrend) and drag to the swing high (or vice versa for a downtrend). The tool will automatically display horizontal lines at key fibonacci retracement levels—23.6%, 38.2%, 50%, 61.8%, and 100%.
Step 4: Observe the generated levels.
Notice how these lines often coincide with areas where price hesitates, reverses, or consolidates. These are your potential support and resistance zones.
Step 5: Analyze price reaction.
Watch how the market interacts with each retracement level. Does price bounce, stall, or break through? This behavior provides clues for planning entries, exits, and stop-loss placement.
Example Walkthrough:
Imagine the S&P 500 rallies from 4,000 to 4,400. After the surge, you draw fibonacci retracement from 4,000 (swing low) to 4,400 (swing high). The 38.2% level appears near 4,248, and the 61.8% level near 4,152. If price pulls back and stalls at 4,248 before resuming upward, that’s a textbook reaction.
Tips for accuracy:
- Use confirmed swing points, not minor fluctuations
- Avoid subjective anchoring—consistency matters
- Combine with other tools for added confirmation
Following this process ensures your fibonacci retracement levels are grounded in objective market structure, not guesswork.
Interpreting Signals: Support, Resistance, and Entry/Exit Points
After plotting fibonacci retracement, the next step is interpreting what these levels mean for your trading decisions. Each line acts as a psychological barrier—potential support in an uptrend, or resistance in a downtrend.
Confirming significance with price action:
Don’t rely on fibonacci retracement alone. Watch for candlestick patterns, momentum shifts, or volume spikes at key levels. For example, a bullish engulfing candle at the 38.2% retracement can signal a strong buy opportunity.
Setting stop-loss and take-profit targets:
Many traders place stop-loss orders just beyond a fibonacci retracement level, reducing the risk of whipsaws. Take-profit targets are often set at the next retracement or extension level, creating a logical, rules-based approach.
Identifying reversal and continuation zones:
The 61.8% retracement is famous for acting as a decision point. If price tests this level and holds, a reversal is possible; if it breaks, expect further continuation in the original trend.
Example:
Suppose you’re long EUR/USD and price retraces to the 50% fibonacci retracement, forming a bullish pin bar. This confluence of support and bullish price action might prompt you to add to your position or tighten your stop.
Key argument:
Fibonacci retracement is not a crystal ball. Think of it as a planning tool—a map that highlights where the crowd might react. Always use it in tandem with broader market analysis and confirmation indicators.
In 2025’s dynamic markets, interpreting fibonacci retracement with a disciplined, multi-factor approach gives you a strong edge. Stick to the process, and let the market show you where the true turning points lie.
Practical Trading Strategies with Fibonacci Retracement
Unlocking the full power of fibonacci retracement goes beyond simply plotting levels—it's about combining this tool with other strategies, adapting to market conditions, and learning from real-world examples. Let's explore how traders are maximizing the potential of fibonacci retracement in 2025.

Combining Fibonacci with Other Technical Indicators
One of the most effective ways to boost fibonacci retracement accuracy is by pairing it with complementary technical indicators. When multiple signals align, traders gain stronger confirmation for their decisions—often referred to as "confluence."
Popular combinations include:
- RSI (Relative Strength Index): Confirms overbought/oversold conditions at fibonacci retracement levels.
- Moving Averages: Identify the prevailing trend, filtering out false signals.
- MACD: Spot momentum shifts near key fibonacci retracement zones.
- Candlestick Patterns: Reveal price action clues for reversals or continuations.
| Indicator | Purpose | How It Combines with Fibonacci Retracement |
|---|---|---|
| RSI | Momentum/Overbought-Oversold | Confirms reversals at retracement levels |
| Moving Averages | Trend direction | Filters trades with trend bias |
| MACD | Momentum & trend confirmation | Spots momentum shifts at support/resistance |
| Candlestick Patterns | Entry/exit signal | Pinpoints price action at fibonacci retracement lines |
For instance, when a price approaches the 61.8% fibonacci retracement level and the RSI indicator in technical analysis signals an oversold market, the odds of a bounce increase. This layered approach reduces the likelihood of acting on false signals and helps traders make more informed decisions.
Entry and Exit Tactics for Different Market Conditions
To harness the full potential of fibonacci retracement, it's crucial to tailor your entry and exit tactics to the market's behavior. Whether the market is trending or ranging, fibonacci retracement adapts to various trading styles.
Trend-Following Strategies:
- Enter on pullbacks to the 38.2% or 50% fibonacci retracement during strong uptrends.
- Use the 61.8% level as a deeper, high-reward entry zone when momentum remains intact.
Countertrend Approaches:
- Watch for potential reversals at the 61.8% or 78.6% fibonacci retracement levels.
- Look for price rejection or reversal candlestick patterns as added confirmation.
Setting Targets and Stops:
- Take-profits can align with fibonacci extensions (e.g., 161.8% level).
- Place stop-loss orders just beyond invalidation points—slightly below/above key fibonacci retracement levels to manage risk.
Here's a quick checklist for applying fibonacci retracement in various conditions:
- Confirm the overall market trend.
- Identify clear swing highs and lows.
- Wait for price action confirmation at fibonacci retracement lines.
- Use additional indicators for extra confidence.
By adapting tactics and recognizing when to trust fibonacci retracement signals, traders can improve both entries and exits, reducing emotional decision-making.
Real-World Case Studies and Chart Examples
Let's see fibonacci retracement in action through real-world trading scenarios. Consider a recent EUR/USD rally. After a significant upward move, price retraced to the 38.2% fibonacci retracement level, forming a bullish engulfing candlestick. This confluence provided a high-probability entry, with a stop-loss placed just below the 50% level and a target at the 161.8% extension.
| Case Study | Entry Level | Stop-Loss | Target | Outcome |
|---|---|---|---|---|
| EUR/USD Rally | 38.2% | Below 50% | 161.8% Extension | Success |
| NASDAQ Pullback | 61.8% | Below 78.6% | 100% Recovery | Partial Profit |
| Failed Setup | 50% (Choppy) | Too Tight | 61.8% | Stopped Out |
However, not every fibonacci retracement setup works as planned. In a NASDAQ example, price dipped to the 61.8% level but failed to rally past the 100% mark, highlighting the importance of context and confirmation. According to backtesting data, price reacts at the 38.2%, 50%, and 61.8% fibonacci retracement levels more frequently—but not always predictably.
The key takeaway? Success with fibonacci retracement comes from disciplined execution, combining levels with market context, and learning from each trade.
Advanced Fibonacci Techniques and Adaptations for 2025
Unlocking the full potential of fibonacci retracement requires more than just the basics. As trading evolves, so do the methods and tools available to traders. Let’s explore the advanced techniques and adaptations that are shaping the way professionals use fibonacci retracement in 2025.
Fibonacci Extensions, Projections, and Clusters
Taking fibonacci retracement to the next level means looking beyond simple pullbacks. Fibonacci extensions allow traders to set profit targets that go beyond the initial swing. By measuring the distance from a swing high to swing low (or vice versa) and projecting outward, traders identify logical zones to take profits or anticipate reversals.
Projections become essential when markets move in complex, multi-leg patterns. Instead of relying solely on basic retracement, traders use fibonacci retracement in combination with projections to map out potential future price action. This is especially effective during strong trends, where the market often respects these calculated levels.
Clusters—areas where multiple fibonacci levels from different swings overlap—serve as “super-zones” of support or resistance. Identifying clusters involves analyzing various timeframes and price legs, then watching for overlapping levels. These zones are magnets for price and often spark significant reactions.
Algorithmic and quantitative strategies are increasingly integrating fibonacci retracement. Many algorithmic systems scan for dynamic fibonacci retracement levels, pairing them with momentum or trend signals for higher accuracy. For a deep dive into these automated applications, check out this Dynamic Fibonacci Retracement Trend-Following Quantitative Strategy.
Real-world example: In a trending market, a trader might use a 161.8% extension as a target after a strong rally, while monitoring cluster zones for signs of exhaustion. The increased adoption of these techniques in algorithmic trading highlights their growing significance for both discretionary and systematic traders.
Integrating Fibonacci with Modern Trading Technologies
The landscape of fibonacci retracement analysis has been transformed by technology. Automated fibonacci retracement tools are now standard on platforms like TradingView and MetaTrader, making it easier than ever to plot accurate levels with just a few clicks.
AI-driven charting software can now identify swing highs and lows, apply fibonacci retracement automatically, and even generate real-time alerts when price approaches key levels. This minimizes human error and allows traders to focus on strategy rather than manual plotting.
But should you rely solely on automation? Let’s compare:
| Method | Pros | Cons |
|---|---|---|
| Manual Plotting | Greater control, context-aware, flexible | Prone to bias, slower, less scalable |
| Automated Tools | Speed, consistency, instant analysis, real-time alerts | May misidentify swings, less adaptable to nuance |
Most traders find a blend works best—use automation for speed, but always review levels for context and accuracy.
Platforms like TradingView streamline fibonacci retracement analysis with built-in tools and customizable alerts. Some even allow for scripting, letting you set up automated fibonacci retracement strategies that adapt to market volatility.
Instant alerts ensure you never miss an opportunity, and real-time analysis helps you respond swiftly to fast-moving price action. In 2025, keeping up with the pace of the market means leveraging these technologies alongside your technical skills.
Criticisms, Limitations, and Psychological Factors
Despite its popularity, fibonacci retracement isn’t a magic bullet. Backtesting studies—such as those referenced in academic reviews—often find no statistically significant edge to specific fibonacci retracement levels. This doesn’t mean the tool is useless; rather, its strength may lie in psychology and crowd behavior.
Because so many traders watch fibonacci retracement zones, they become self-fulfilling. Price often reacts at these levels not because of mathematical precision, but due to collective expectation and herd mentality.
Psychological comfort plays a role, too. Round numbers like 50% or the golden ratio 61.8% offer a sense of order in chaotic markets, leading traders to cluster orders around these points. However, over-reliance on fibonacci retracement can lead to confirmation bias, where traders see what they want to see and ignore conflicting evidence.
To avoid these pitfalls:
- Always confirm fibonacci retracement signals with price action or other indicators.
- Don’t force fibonacci retracement onto every chart—context matters.
- Be flexible and willing to adapt when the tool fails.
When fibonacci retracement doesn’t work, step back. Reassess your swings, check for broader market factors, and remember: discipline and adaptability are more valuable than blind faith in any single method.
Common Mistakes and How to Avoid Them When Using Fibonacci Retracement
Even the most seasoned traders can stumble when applying fibonacci retracement. In fast-paced markets, small errors can lead to costly missteps. Recognizing the most common pitfalls will help you avoid unnecessary losses and build a more reliable trading process.
Anchoring Errors and Market Context
One of the most frequent mistakes with fibonacci retracement is misidentifying swing highs and lows. If you anchor the tool to the wrong points, the resulting levels become unreliable. This often happens when traders rush, ignore confirmed price swings, or use subjective references.
Equally problematic is ignoring market context. Applying fibonacci retracement in sideways or illiquid markets leads to false signals and unreliable setups. Always check if the asset is trending, as retracement levels hold more weight in clear trends.
According to Fibonacci Retracement Levels: A Complete Trading Guide, accurately anchoring your tool and respecting market conditions are foundational to effective analysis.
Overfitting and Lack of Confirmation
Some traders fall into the trap of overfitting—forcing fibonacci retracement onto every chart, even when it doesn’t fit. Not every price move requires this tool; sometimes, the market simply doesn’t align with fibonacci principles.
Another major error is failing to confirm retracement signals with other indicators or price action. Relying solely on fibonacci retracement, without supporting evidence from trendlines, volume, or candlestick patterns, often leads to false confidence.
To improve your trade decisions, combine fibonacci retracement with price action trading strategies for stronger confirmation and clearer entries.
Stop-Loss Placement and Real-World Case Study
Improper stop-loss placement is another risk. Placing stops too close to fibonacci retracement levels can expose your trades to market noise, resulting in premature exits or “whipsaws.” Give your trades enough room—set stops just beyond the next major level or recent swing.
Consider this example: A trader anchors their fibonacci retracement incorrectly, sets a tight stop just below the 61.8% level, and gets stopped out on a minor pullback—only to see the price reverse and hit their original target. This scenario is all too common and highlights the importance of accuracy and discipline.
Consistency and Discipline Over “Magic” Levels
Ultimately, success with fibonacci retracement isn’t about finding a hidden formula. It’s about consistent application and disciplined risk management. Surveys from trading forums show that traders who document their setups, confirm with other tools, and adapt to changing conditions outperform those chasing “magic” levels.
Treat fibonacci retracement as a planning tool—never a guarantee. Stay objective, keep learning, and always remember: discipline is the true edge in any market.
Expert Tips, Resources, and Tools for Mastering Fibonacci Retracement in 2025
Staying ahead in trading means constantly refining your approach to fibonacci retracement. As 2025 brings faster markets and evolving technologies, traders who embrace proven habits, cutting-edge tools, and reliable educational resources will stand out.
Best Practices from Professional Traders
Professional traders treat fibonacci retracement as one key part of a larger trading plan—not a standalone solution. They consistently backtest their strategies, monitor outcomes, and adjust as market conditions shift.
Keeping a detailed trading journal is essential. Document each fibonacci retracement setup, noting entry and exit points, trade rationale, and results. This habit uncovers patterns in your own decision-making and highlights areas for improvement.
Flexibility is another hallmark of success. Markets in 2025 can change direction quickly, so adapt your approach to fit new volatility regimes or asset classes. Top traders also stress the importance of risk management—using fibonacci retracement to define stop-loss and take-profit levels, but never placing all their trust in any single indicator.
Continuous learning is vital. Engage with webinars, forums, and mentorship programs to exchange insights and refine your fibonacci retracement skills alongside peers.
Recommended Tools, Platforms, and Further Learning
Choosing the right tools can make all the difference. Charting platforms like TradingView and MetaTrader offer robust, user-friendly fibonacci retracement features—often with AI-powered detection and instant alerts. Many traders now combine fibonacci retracement with chart pattern analysis, as explored in Trading chart pattern basics, to boost accuracy and confidence.
For up-to-date techniques and platform-specific guidance, resources such as Fibonacci Retracement: Identifying Support & Resistance in 2025 provide practical strategies tailored to modern environments.
When evaluating fibonacci retracement resources, consider this checklist:
| Criteria | Why It Matters |
|---|---|
| Platform Reliability | Ensures accurate plotting |
| Customization | Adapts to your trading style |
| Community Support | Access to shared insights |
| Educational Content | Facilitates ongoing learning |
Leverage these tools and resources to maintain a disciplined, data-driven approach to fibonacci retracement.
Now that you’ve got a strong handle on how to use Fibonacci retracement in today’s markets, imagine how much easier trading could be with real-time, AI-driven signals at your fingertips. You don’t have to second-guess your entry and exit points or worry about missing key levels—let’s put all this knowledge to work with a tool that’s built for clarity and consistency. If you’re ready to see the difference for yourself and truly simplify your trading in 2025, See Your Trading Improve With PipTrend—it’s time to trade smarter, not harder.