
In today’s lightning-fast markets, understanding the s&p 500 futures chart is more crucial than ever for traders aiming to stay ahead. This guide will empower you with essential knowledge and step-by-step strategies to confidently read and analyze the s&p 500 futures chart for 2025.
You’ll discover the fundamentals of chart reading, explore key data points, master technical indicators, and learn how to apply live analysis techniques for real trading decisions. Whether you’re a seasoned investor or just starting out, mastering these skills can give you a real edge.
Ready to become a more informed trader? Dive in and unlock the tools you need for smarter trades and better outcomes in the evolving world of S&P 500 futures.
Understanding S&P 500 Futures and Their Importance
What Are S&P 500 Futures?
S&P 500 futures are standardized contracts that allow traders and investors to speculate on the future value of the S&P 500 index. Unlike trading the index itself, these contracts represent an agreement to buy or sell the index at a set price on a specific date in the future.
There are several contract types: the standard S&P 500 futures, the E-mini, and the Micro E-mini. For example, the S&P 500 E-mini Sep '25 contract is popular for its lower margin requirements and high liquidity.
These futures play a vital role in global financial markets by providing a tool for hedging, speculation, and portfolio balancing. Institutions and individual traders use them to manage risk, access leverage, and take positions around the clock. Their 24-hour trading window allows for real-time reactions to global news and events. For a deeper dive into contract details and history, see the S&P 500 Futures Overview.
Why S&P 500 Futures Charts Matter in 2025
The s&p 500 futures chart is an early indicator of market sentiment, often moving before the cash market opens. In 2025, with economic cycles shifting, inflation pressures, and interest rate changes, these charts will be more influential than ever.
Pre-market moves in S&P 500 futures can set the tone for the entire trading day. Professional traders, hedge funds, and institutions closely monitor these charts to gauge momentum and prepare their strategies. Retail participation has also increased thanks to technological advancements, making the s&p 500 futures chart an essential tool for all market participants.
In fast-moving environments, the ability to interpret these charts can provide a distinct edge. Understanding chart signals helps traders anticipate volatility and adapt to rapid market changes.
Key Data Points and Chart Elements
When analyzing an s&p 500 futures chart, several data points are crucial:
- Price: Shows current and historical levels.
- Volume: Indicates the number of contracts traded, revealing market interest.
- Open Interest: Reflects active positions, hinting at trend strength.
- Bid/Ask Spread: The gap between buyers and sellers, impacting trade execution.
- Expiration Dates: Futures contracts have set lifespans, requiring attention to rollovers.
- Price Ladder, Tick Sizes, Point Values: Help measure movement and risk.
- Real-Time vs. Delayed Data: Timeliness is key for actionable insights.
For example, CME contract specifications outline tick sizes and expiration cycles for 2025, offering a foundation for understanding price dynamics on the s&p 500 futures chart.
Types of S&P 500 Futures Charts
There are several chart types used to analyze the s&p 500 futures chart:
- Candlestick Charts: Show open, high, low, and close, ideal for pattern recognition.
- Line Charts: Simplify trends using closing prices.
- OHLC Charts: Display open, high, low, close in bar format.
- Area Charts: Highlight overall direction with filled areas.
Timeframes vary from intraday (minutes, hours) to daily, weekly, and monthly views. Streaming charts, like those on Investing.com, offer real-time updates, while static charts are suitable for end-of-day analysis.
Use candlestick charts to spot reversals and line charts for broader trend analysis. Choosing the right chart type and timeframe enhances your ability to interpret the s&p 500 futures chart effectively.
Core Components of the S&P 500 Futures Chart
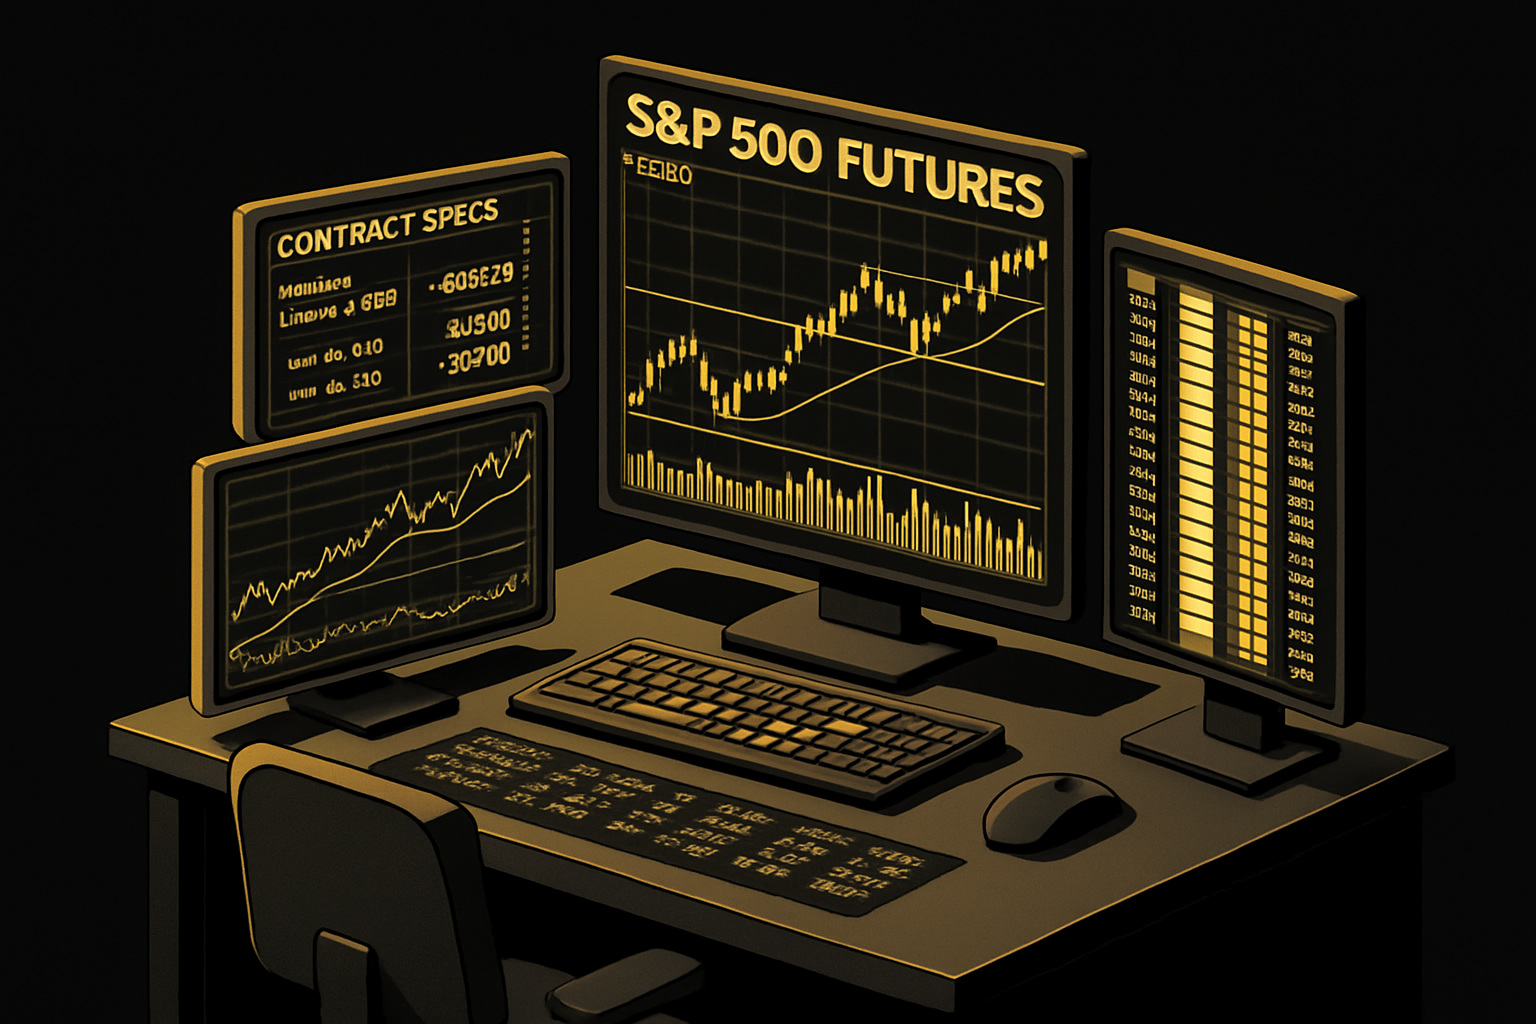
Understanding the core components of the s&p 500 futures chart is crucial for every trader. Each element reveals unique insights into market behavior, helping you make smarter, more confident decisions.
Price Action and Candlestick Patterns
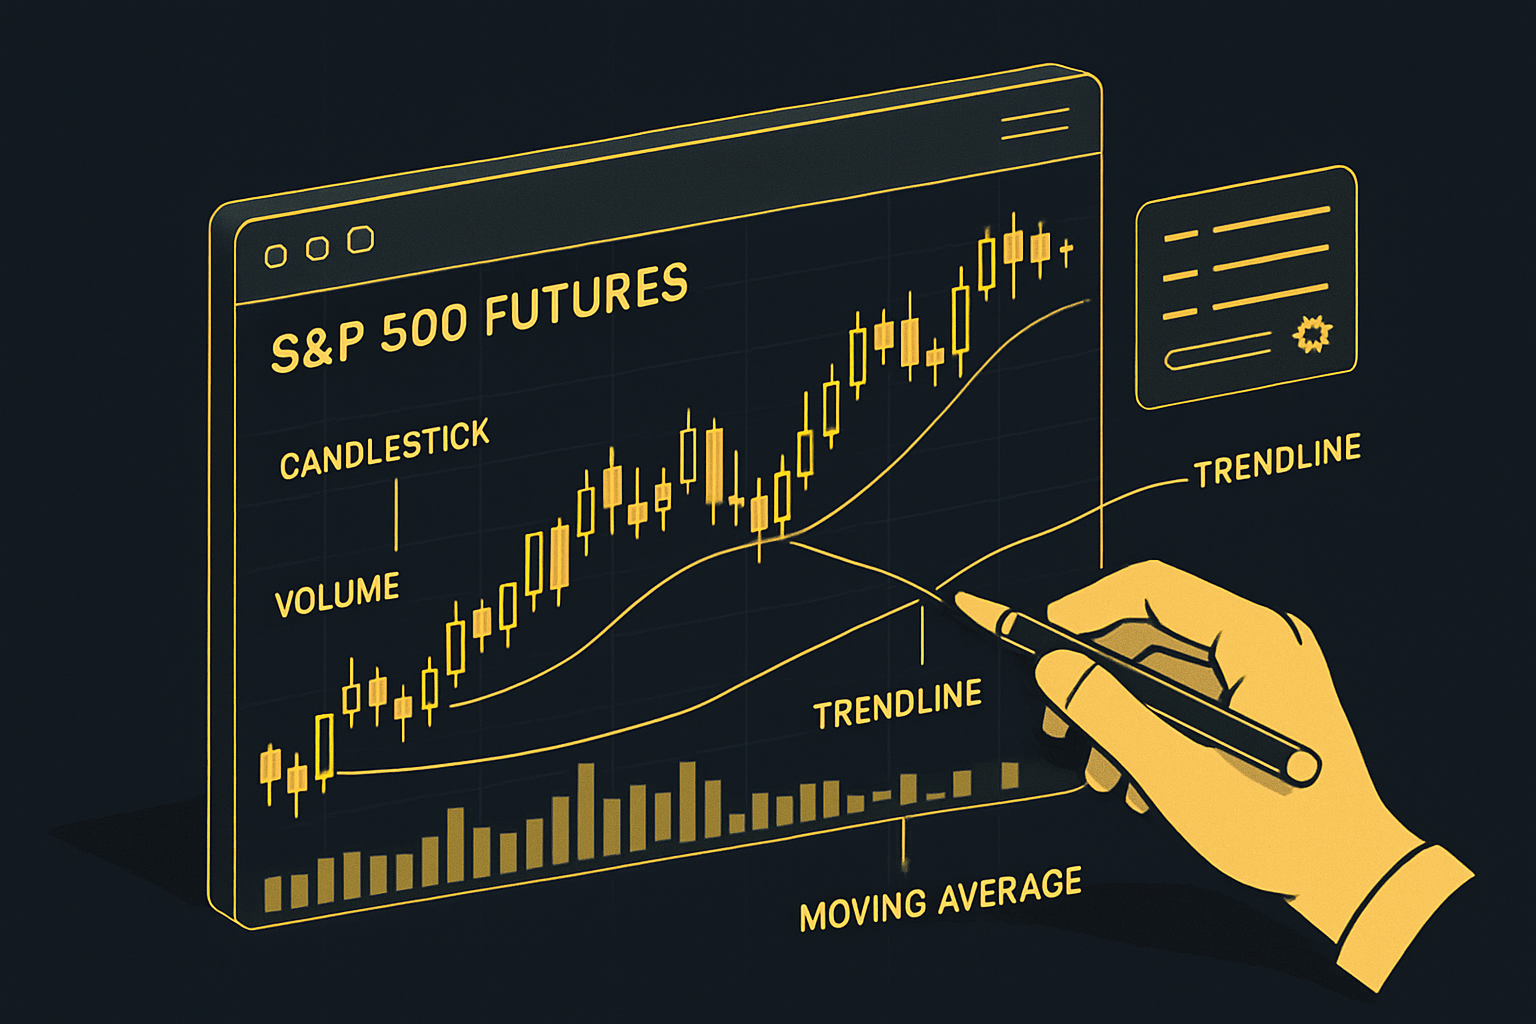
Price action is the heartbeat of the s&p 500 futures chart. By studying the movement of price bars and candlesticks, you can spot shifts in sentiment and momentum.
Every candlestick tells a story with its open, high, low, and close. Patterns like doji, hammer, and engulfing often signal reversals or continuation. For example, a hammer at a key support level can indicate a potential bounce, especially during volatile 2025 sessions. Want to master this pattern? Check out the Hammer candlestick pattern explained guide for deeper insights.
Focus on reading the wicks and bodies to gauge momentum. Recognizing these patterns helps you anticipate market moves and adapt your trading style.
Volume and Open Interest Analysis
Volume and open interest are vital data points on the s&p 500 futures chart. Volume shows how many contracts are traded in a given period, while open interest tracks the total number of outstanding contracts.
High volume during economic news can confirm strong participation. If price rises on increasing volume, the trend is likely strong. Conversely, if price moves up but volume drops, the move may lack conviction. Watch for divergence between price and volume as an early warning.
Open interest helps you gauge trend sustainability. Rising open interest alongside price movement often supports the current trend, while falling open interest could suggest a reversal is near.
Support, Resistance, and Trendlines
Support and resistance zones are the backbone of the s&p 500 futures chart. Support acts as a floor where buying emerges, while resistance is a ceiling where selling pressure builds.
To identify these levels, mark horizontal lines at recent swing highs and lows. Trendlines help you visualize the broader direction—draw them by connecting at least two key points. For 2025, watch how the S&P 500 futures bounce at major support or reject resistance.
Institutions often anchor strategies around these zones. Spotting breakouts or reversals at these points can lead to higher-probability trades, especially when combined with other chart signals.
Technical Indicators and Overlays
Technical indicators add another layer of analysis to the s&p 500 futures chart. Popular choices include moving averages (SMA, EMA), Bollinger Bands, RSI, and MACD.
Overlays like moving averages help confirm trend direction and smooth out noise. For example, the 50-day and 200-day moving averages are often used to spot cycles and momentum shifts in 2025. Combining indicators—such as using RSI for overbought/oversold signals with MACD for trend confirmation—can improve trade accuracy.
However, avoid cluttering your s&p 500 futures chart with too many indicators. Stick to a few that align with your strategy to maintain clarity and focus.
Chart Settings and Customization
Customizing your s&p 500 futures chart is essential for effective analysis. Adjusting timeframes—such as intraday for scalping or daily for swing trading—lets you tailor the chart to your style.
Use multi-chart layouts to view different timeframes or indicators side by side. Change color schemes and add drawing tools for easier trendline or support/resistance marking. Save templates to streamline your workflow and reduce repetitive setup time.
A clear, uncluttered chart helps you interpret data quickly and avoid analysis paralysis. Regularly review your settings to ensure your chart stays aligned with your evolving trading needs.
Step-by-Step Guide: How to Read and Analyze the S&P 500 Futures Chart
Mastering the s&p 500 futures chart starts with a systematic approach. Whether you’re a day trader or a long-term investor, following a clear process helps you avoid confusion and make confident decisions.
Below, you’ll find a detailed, step-by-step guide that walks you through everything from picking the right contract to reviewing your trades. Let’s break it down together.
Step 1: Select the Correct Contract and Timeframe
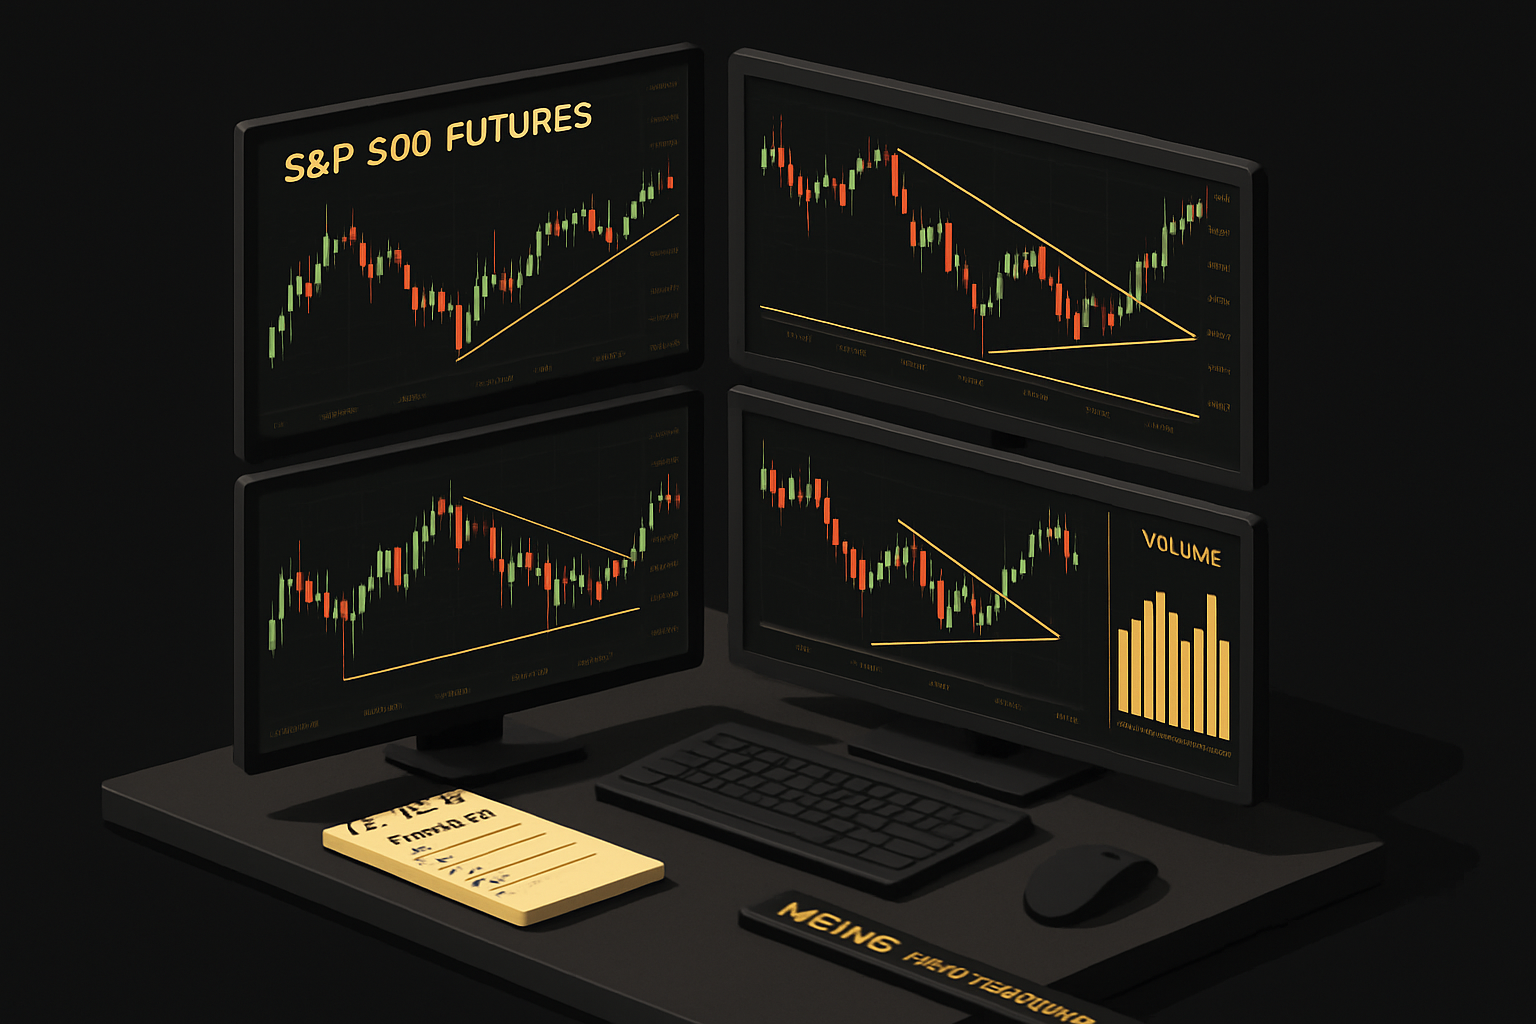
Begin by choosing the appropriate S&P 500 futures contract, such as the September 2025 (Sep '25) E-mini. Always verify the contract’s expiration date to avoid trading an inactive future. When analyzing the s&p 500 futures chart, select a timeframe that matches your trading style—shorter intervals like 5-minute or 15-minute for day trading, or daily/weekly for swing trading.
For live, up-to-date analysis, use platforms like the S&P 500 Futures Live Chart, which provides real-time data and multiple timeframe options. This ensures accuracy when interpreting price action.
Step 2: Assess Market Context and News
Before diving into the s&p 500 futures chart, check the economic calendar for major events that may influence volatility. Key reports—like CPI releases or Federal Reserve meetings—often spark significant moves. Review overnight and pre-market activity to gauge current sentiment and potential gaps.
Correlate global news headlines with recent price movements. Use sentiment analysis tools and news feeds to stay ahead. Understanding the broader context helps you avoid surprises and better interpret chart signals as they unfold.
Step 3: Analyze Price Action and Identify Patterns
Carefully study the s&p 500 futures chart for recognizable price action signals. Look for candlestick patterns such as dojis, hammers, and engulfing formations, which can hint at reversals or continuations. Identify whether the market is trending or ranging—this shapes your strategy.
Use pattern recognition tools or visually scan for breakouts and consolidations. Be wary of false signals, especially during high-volatility periods. Consistent pattern analysis builds your intuition and sharpens your entry timing.
Step 4: Apply Key Technical Indicators
Enhance your s&p 500 futures chart analysis by adding technical indicators like moving averages (SMA, EMA), Bollinger Bands, RSI, and MACD. These overlays help confirm trend direction and highlight potential reversal points.
Interpret indicator signals alongside price action to avoid conflicting messages. For example, watch for RSI divergences during sharp 2025 swings. Always backtest indicator setups to see how they perform historically, and beware of overcomplicating your chart.
Step 5: Mark Support, Resistance, and Trendlines
Draw horizontal lines at recent swing highs and lows on your s&p 500 futures chart to mark support and resistance. Use trendlines to connect higher lows or lower highs for channel trading opportunities. These visual cues reveal where price might pause, bounce, or break through.
Apply Fibonacci retracements for deeper insight into potential pullback levels. Adjust your levels as new price data emerges, ensuring your analysis stays relevant and actionable for current market conditions.
Step 6: Monitor Volume and Open Interest
Volume tells you how many contracts are being traded, while open interest shows the number of active positions. On the s&p 500 futures chart, look for volume spikes during news releases or at key price levels—they often confirm the strength of a move.
Compare volume across different timeframes to spot unusual activity. Use volume profile tools to visualize where the most trading occurs. Monitoring these metrics helps you validate trends and avoid false breakouts.
Step 7: Execute and Review Trades
With your s&p 500 futures chart analysis complete, define clear entry, stop loss, and take profit levels. Position sizing should align with your risk tolerance and account size. After each trade, review your process by saving chart screenshots and journaling outcomes.
Regularly assess what worked and what didn’t. Adapting your approach based on chart feedback and performance metrics leads to continuous improvement and trading confidence.
Advanced Chart Analysis Strategies for 2025
Unlocking the full potential of the s&p 500 futures chart in 2025 means moving beyond the basics. Advanced techniques let you see deeper patterns, anticipate market moves, and manage risk with precision. Let’s dive into five proven strategies every trader should master for the year ahead.
Multi-Timeframe Analysis
Analyzing the s&p 500 futures chart across different timeframes is essential for filtering noise and confirming trends. Start by reviewing the daily chart for the overall direction, then move to the 4-hour and 1-hour charts for more precise entries. This layered approach helps you avoid false signals common in a single timeframe.
Key steps for effective multi-timeframe analysis:
- Identify major support and resistance on higher timeframes
- Confirm trend alignment before placing trades
- Use lower timeframes for optimal entry and exit timing
For a step-by-step walkthrough, check out these multi-timeframe analysis techniques to sharpen your edge.
Order Flow and Depth of Market Insights
Order flow analysis lets you peek behind the curtain of the s&p 500 futures chart. By monitoring the order book and market depth, you can spot where big players are stacking bids and offers. This information is crucial before major moves, as sudden imbalances often signal upcoming volatility.
Here’s how to leverage order flow:
- Watch for large bid/ask accumulations before breakouts
- Notice “iceberg” orders that hint at hidden institutional interest
- Use specialized tools to visualize real-time market depth
Combining order flow with chart patterns leads to more confident, data-driven decisions.
Seasonal and Cyclical Patterns in S&P 500 Futures
Seasonal trends can have a subtle but powerful effect on the s&p 500 futures chart. For example, the “Sell in May” effect and election-year cycles often shape market sentiment. Studying past years helps anticipate potential moves in 2025.
Ways to incorporate seasonality:
- Backtest historical performance for recurring trends
- Overlay monthly or quarterly patterns on your chart
- Combine seasonal bias with technical setups for higher probability trades
Recognizing these cycles keeps you proactive instead of reactive.
Risk Management and Position Sizing Techniques
No advanced strategy for the s&p 500 futures chart is complete without strong risk management. Position sizing should reflect your account size, market volatility, and trade setup. Always set stop losses based on chart structure, not emotions.
Best practices include:
- Calculate risk/reward ratios before every trade
- Adjust position size when volatility spikes
- Regularly review margin requirements and leverage
A disciplined approach protects your capital and ensures longevity in fast-moving markets.
Incorporating AI-Powered Trading Tools
AI-driven tools are transforming how traders interpret the s&p 500 futures chart. These smart indicators scan multiple timeframes, generate real-time signals, and adapt to changing conditions. By integrating AI with your manual analysis, you can reduce errors and speed up decision-making.
Benefits of using AI-powered tools:
- Automated trend and reversal detection
- Instant alerts for high-probability setups
- Objective, emotion-free analysis
Use AI as a supplement, not a replacement, to stay ahead in the ever-evolving trading landscape.
Live Chart Platforms and Tools for S&P 500 Futures Analysis
Navigating the world of s&p 500 futures chart analysis starts with choosing the right tools and platforms. The right charting platform can make all the difference in how effectively you interpret price action, spot trends, and make timely trading decisions. With so many options in 2025, understanding the features, tools, and innovations available is crucial for any trader looking to stay ahead.
Top Charting Platforms: Features and Comparisons
When analyzing the s&p 500 futures chart, platform choice is your foundation. The top contenders—TradingView, Investing.com, and Barchart.com—offer robust real-time streaming and customization.
| Platform | Real-Time Data | Customization | Mobile Access | Alerts | Cost |
|---|---|---|---|---|---|
| TradingView | Yes | High | Yes | Yes | Freemium |
| Investing.com | Yes | Moderate | Yes | Yes | Free |
| Barchart.com | Yes | High | Yes | Yes | Subscription |
TradingView stands out for its intuitive interface and extensive s&p 500 futures chart tools. Investing.com is accessible and free, perfect for quick checks or beginners. Barchart.com appeals to data-driven traders with deep analytics. For a deeper dive into price levels and real-world chart analysis, check out the S&P 500 Futures Price Action Roadmap.
Essential Tools for Futures Chart Analysis
Every serious trader needs a set of essential tools to get the most out of their s&p 500 futures chart. Drawing tools allow you to mark support, resistance, and trendlines with precision.
Must-have features include:
- Multi-chart views for simultaneous timeframe analysis
- Custom alerts for major price movements
- Integration with brokers for seamless order execution
Reliable data feeds are vital to avoid lags that could cost you. User-friendly interfaces and a gentle learning curve help traders of all levels leverage the full capabilities of their charting platforms. The right mix of tools streamlines your workflow and keeps your s&p 500 futures chart analysis efficient.
Using AI-Powered Indicators for S&P 500 Futures
The integration of AI-powered indicators has transformed how traders interact with the s&p 500 futures chart. AI tools now help identify trends, reversals, and momentum shifts with greater speed and accuracy than ever before.
Automated buy/sell signals, generated directly on your chart, reduce the risk of emotional trading. When you combine AI insights with manual analysis—such as overlays like RSI or Bollinger Bands—you create a more robust trading strategy. For a breakdown of how technical indicators like Bollinger Bands can be applied, see the Bollinger Bands indicator guide.
Evaluating the performance of AI tools and backtesting them on historical s&p 500 futures chart data is essential for building trust in their signals.
How PipTrend Enhances S&P 500 Futures Chart Analysis
PipTrend’s AI-powered indicator is a game-changer for s&p 500 futures chart users. It delivers real-time buy and sell signals, giving you instant alerts whenever the market shifts.
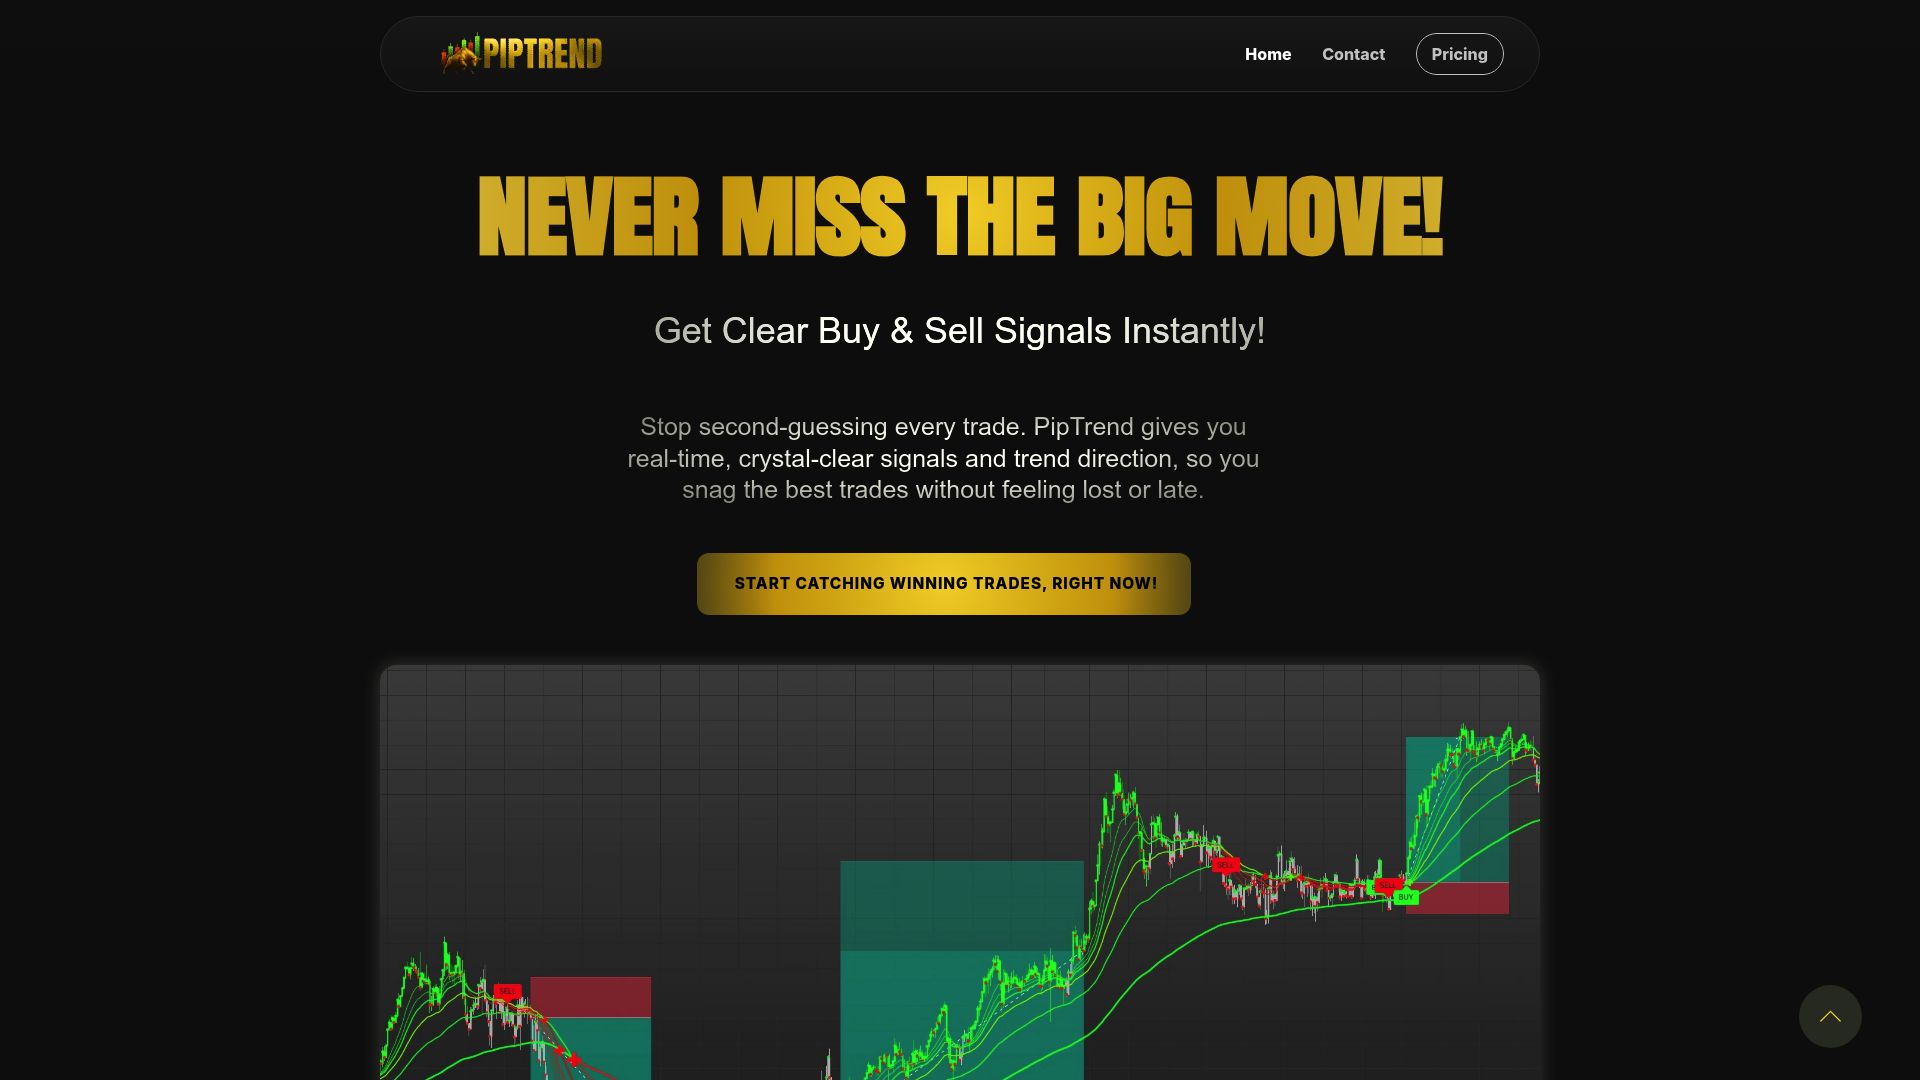
With a multi-timeframe dashboard, PipTrend helps confirm trend direction and filter out false signals. The setup is beginner-friendly, with customizable interfaces to suit every trader’s style. Seamless integration with TradingView means you can analyze the s&p 500 futures chart and other major indices in one place.
PipTrend’s clear, actionable signals support risk management, empowering you to make confident trading decisions in 2025 and beyond.
Common Pitfalls and Pro Tips for S&P 500 Futures Chart Analysis
Avoiding Analysis Paralysis and Overtrading
One of the most common traps when working with the s&p 500 futures chart is analysis paralysis. With so many indicators, chart types, and data points available, it’s easy to clutter your workspace and overthink every move.
- Too many overlays or conflicting signals can lead to hesitation or impulsive trades.
- Chart clutter can obscure clear price action, making it tough to spot quality setups.
- Overtrading often follows when you try to “force” trades from noisy charts.
To combat this, set strict rules for your chart layouts and stick to proven methods. Focusing on price action trading strategies is a powerful way to simplify your approach and build confidence. Remember, less is more when analyzing the s&p 500 futures chart.
Managing Emotional Bias and News Overload
Emotion is a silent saboteur for anyone reading the s&p 500 futures chart. Cognitive biases can cloud judgment, especially after a major news event or a string of wins and losses.
- Emotional trading often leads to chasing moves or adding risk impulsively.
- News overload can distract from your trading plan and trigger hasty decisions.
- Confirmation bias may cause you to see signals that match your expectations, ignoring contrary evidence.
Stay objective by journaling your trades, using checklists before entering positions, and setting up alerts to automate decisions. Regularly step back and assess your mindset, ensuring your s&p 500 futures chart analysis is driven by logic, not emotion.
Staying Updated with Market Changes in 2025
The s&p 500 futures chart landscape is rapidly evolving. New technology, regulations, and global events can shift market dynamics in an instant.
- Algorithmic trading and AI-driven tools are changing how charts behave.
- Economic cycles and policy changes will shape the 2025 trading environment.
- Staying current is essential for interpreting the s&p 500 futures chart accurately.
Leverage live resources like S&P 500 Futures Analysis to track key levels and market sentiment in real time. Schedule regular chart reviews and adapt your strategies as the market shifts.
Pro Tips for Consistent Chart-Based Trading Success
Achieving consistency with the s&p 500 futures chart demands both discipline and adaptability. Testing and refining your methods is the foundation of success.
- Backtest and forward-test your strategies on demo accounts.
- Track your performance metrics and adjust your approach as needed.
- Network with other traders to share insights and stay motivated.
Invest in your education, use advanced tools, and never stop learning. The s&p 500 futures chart rewards those who combine structured analysis with continuous improvement.
Now that you’ve got a step-by-step plan for reading and analyzing the S&P 500 futures chart in 2025, why not take your trading to the next level with tools designed to simplify your process? With PipTrend’s AI-powered signals and real-time alerts, you can cut through the noise and make more confident, consistent decisions—without second-guessing yourself. Whether you’re looking to spot trends faster or just want clearer, actionable signals, PipTrend has you covered. If you’re ready to see real improvements in your chart-based trading, See Your Trading Improve With PipTrend.