
In 2025, traders are searching for every possible edge as markets become more competitive and data-driven. The vwap indicator has emerged as a must-have tool, trusted by professionals to decode price action and volume in real time.
This guide breaks down everything you need to know: what VWAP is, why it matters, how it stacks up against other indicators, and actionable strategies you can use right away. Ready to upgrade your trading and master VWAP for the modern era? Dive in and discover how to take your trading to the next level.
Understanding the VWAP Indicator: Fundamentals and Calculation
The vwap indicator is a cornerstone tool for traders aiming to understand real market value at any given moment. In a world where milliseconds can mean the difference between profit and loss, mastering VWAP is essential. Let’s explore what makes this indicator so powerful, how it’s calculated, and how it appears on your trading charts.
What is VWAP? Definition and Core Concept
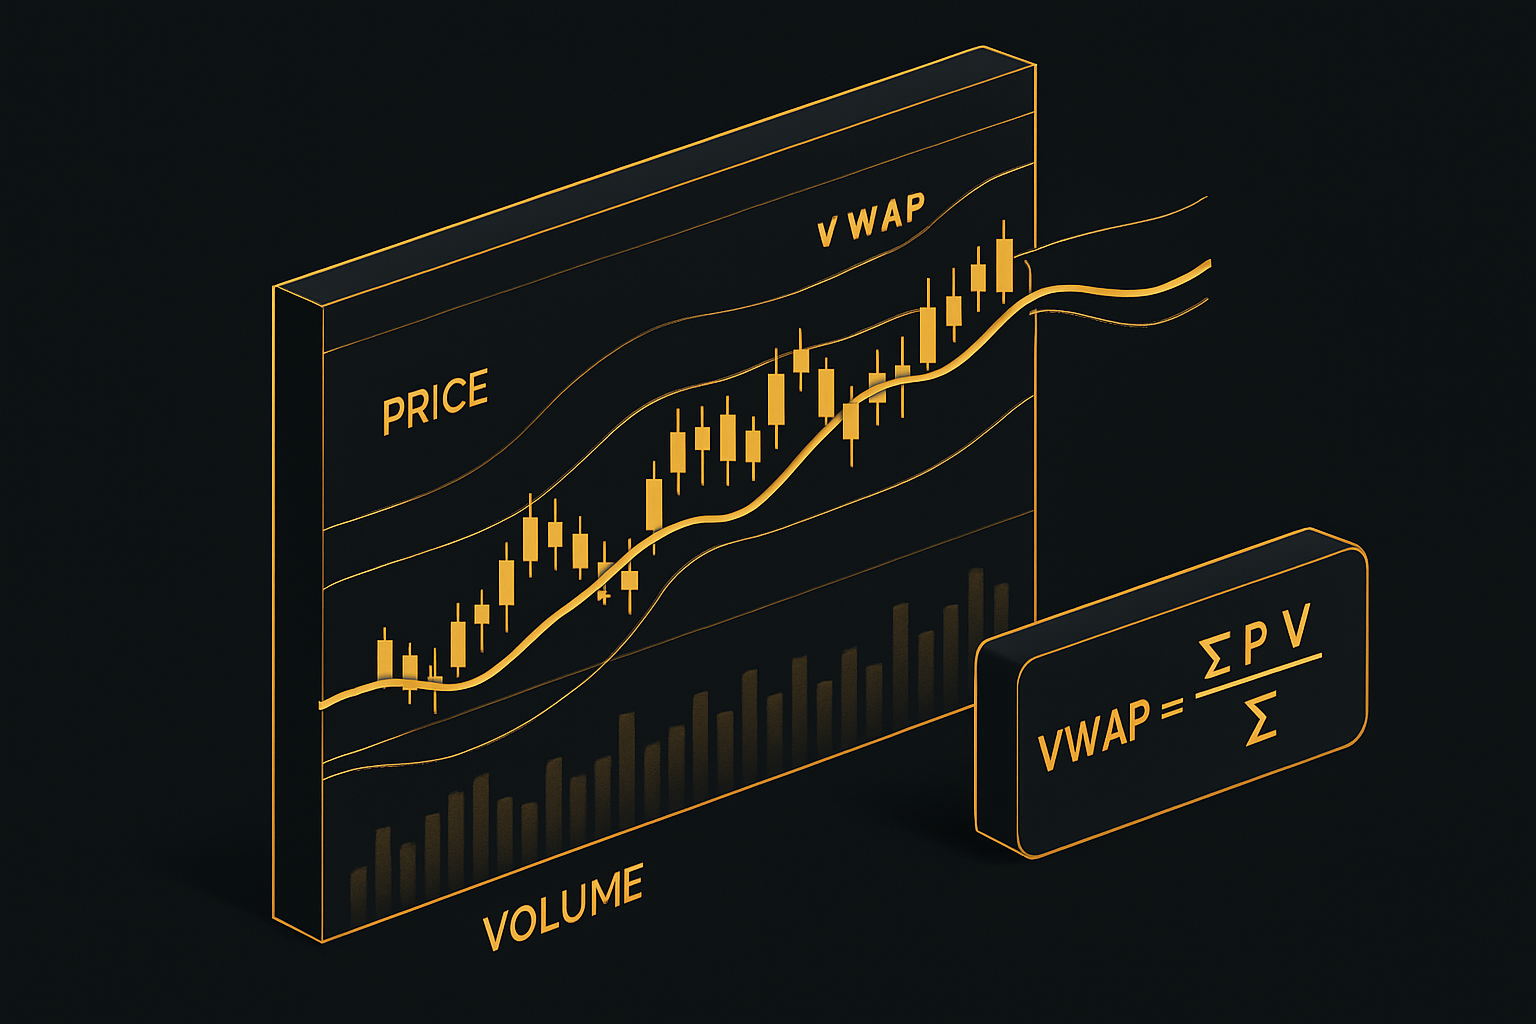
The vwap indicator, or Volume Weighted Average Price, represents the average price of a security traded throughout a specific period, weighted by volume. Unlike simple moving averages, VWAP factors in both price and the amount of shares traded at each price, offering a more accurate reflection of where the majority of trading activity is occurring.
Why do traders care so much about the vwap indicator? For one, it acts as a benchmark for institutions and retail traders alike. According to Tradervue, over 90% of professional traders use VWAP for analyzing trades and making execution decisions. This widespread adoption is due to its ability to highlight whether a trade is executed at a fair price relative to the day’s trading activity.
Let’s look at a real-world scenario: Imagine a stock starts the day at $100, surges to $105, and then dips to $98 with varying trade volumes at each price. The vwap indicator will “follow the money,” reflecting the true average price where most volume changed hands, not just a simple average of high and low prices.
VWAP is especially popular among day traders, swing traders, and algorithmic systems. It allows for dynamic assessment of price action, making it invaluable for benchmarking trade execution quality and for identifying areas of support and resistance.
For a deeper dive into why VWAP is so important for traders and analysts, you can explore this Importance of VWAP for Traders and Analysts resource.
VWAP Formula: Step-by-Step Calculation
At its core, the vwap indicator is calculated using a straightforward formula:
VWAP = Σ (Price × Volume) / Σ (Volume)
Let’s break this down:
- Price: The trade price at each interval (minute, tick, etc.)
- Volume: The number of shares/contracts traded at that price
- Time period: The session or custom period over which you’re calculating VWAP
Here’s how it works in practice. Suppose you have three trades:
- Trade 1: 100 shares at $50
- Trade 2: 200 shares at $51
- Trade 3: 150 shares at $52
Plugging into the formula:
- (100 × $50) + (200 × $51) + (150 × $52) = $5,000 + $10,200 + $7,800 = $23,000
- Total volume = 100 + 200 + 150 = 450 shares
VWAP = $23,000 / 450 = $51.11
Accurate volume data is crucial. If the volume is incorrectly recorded, the vwap indicator will be misleading. While most trading platforms calculate VWAP automatically, understanding this math allows traders to trust the indicator and spot any discrepancies.
Whether you’re trading stocks, forex, or futures, knowing how VWAP is derived gives you an edge in execution and analysis.
VWAP Line and Chart Representation
On trading charts, the vwap indicator appears as a single, smooth line that updates in real time. On intraday charts, it starts at the opening bell and recalculates with each new trade, reflecting the current average price weighted by volume.
The VWAP line acts as a dynamic support or resistance level. When price trades above the vwap indicator, it signals bullish sentiment; when below, bearishness prevails. Advanced traders often use VWAP bands—lines plotted one or two standard deviations from the VWAP—to create a channel similar to Bollinger Bands. This helps visualize overbought or oversold conditions relative to the session’s average trading price.
Most trading platforms allow customization of the VWAP’s color, thickness, and whether to display bands. For example, a trader might set the VWAP line to gold and the bands to subtle gray, making it easy to spot price interactions at a glance.
VWAP is not just a static indicator; its real power comes from how it adapts to the ebb and flow of market activity, helping traders identify key levels and make informed decisions.
VWAP vs. Other Technical Indicators: Comparative Analysis
In today’s fast-paced markets, choosing the right technical tools is crucial for success. The vwap indicator stands out for its unique ability to blend price and volume, but how does it compare to other popular indicators? Let’s break down the differences and see where VWAP fits in a modern trading toolkit.
 Technical Indicators: Comparative Analysis">
VWAP vs. Simple Moving Average (SMA) and Exponential Moving Average (EMA)
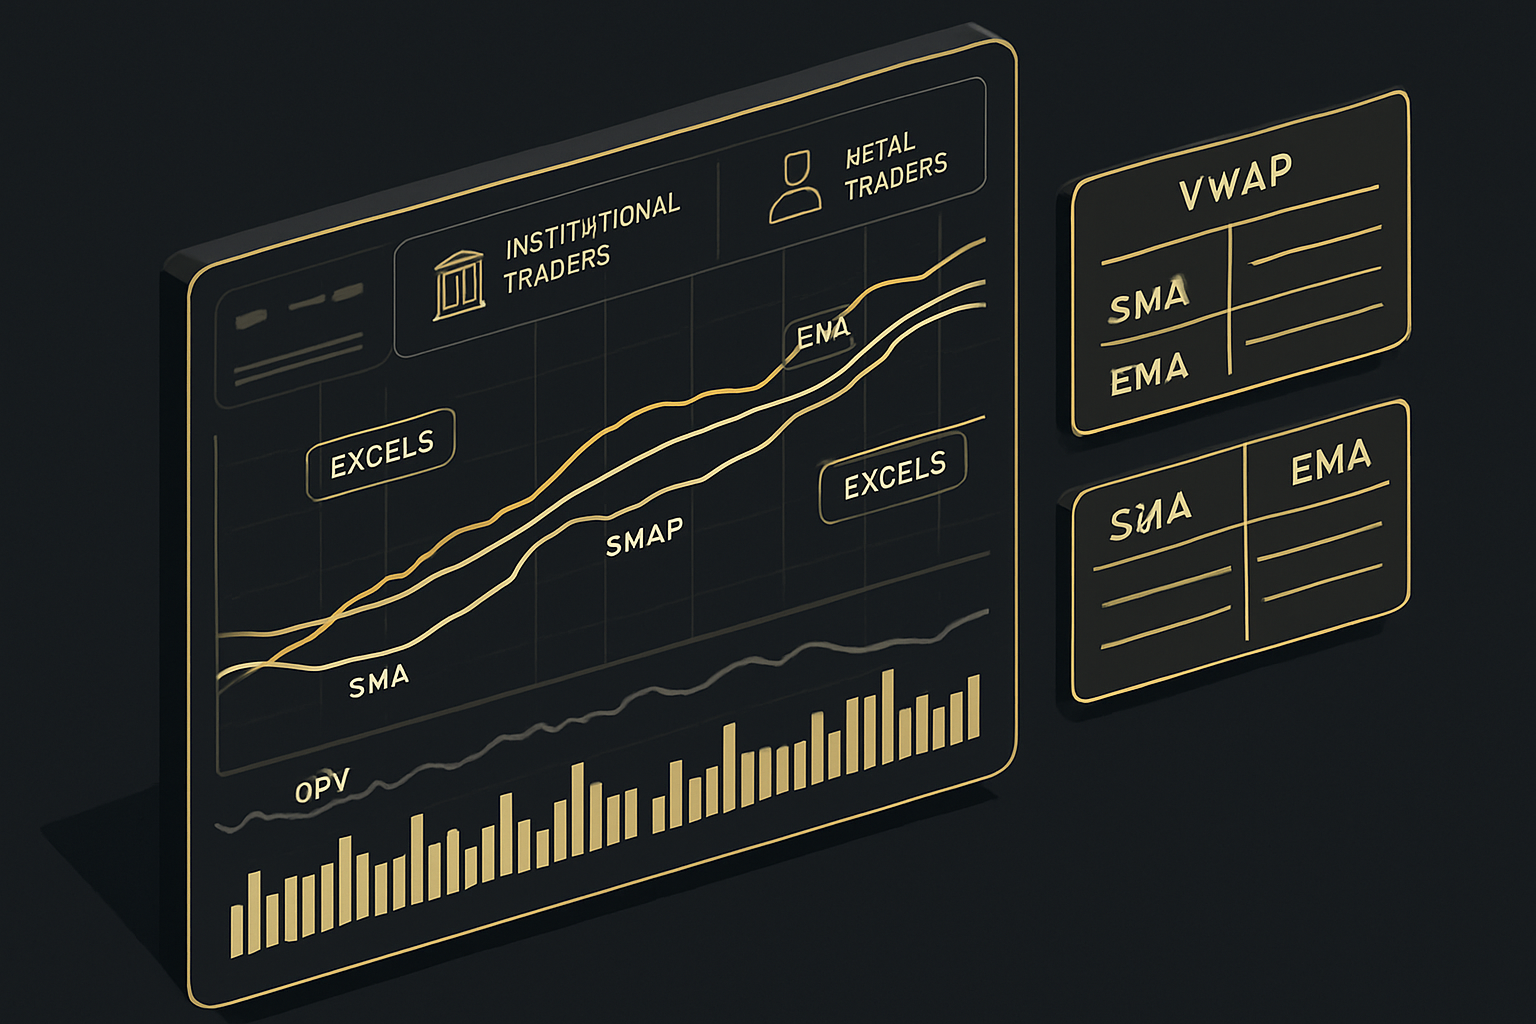
The vwap indicator differs fundamentally from moving averages like the SMA and EMA. SMA calculates the mean of closing prices over a period, giving each data point equal weight. EMA, on the other hand, puts more emphasis on recent prices, making it more responsive to current market moves.
VWAP’s distinct advantage is its volume weighting. Each price is multiplied by its trading volume, then averaged over the session. This means VWAP reflects where most trading actually occurs, offering a more accurate view of real market sentiment. For traders, this reduces the impact of outlier prices that may not represent true buying or selling interest.
Here’s a quick comparison:
| Feature | VWAP Indicator | SMA | EMA |
|---|---|---|---|
| Weights Volume | Yes | No | No |
| Reacts to Recent Prices | Moderately | No | Yes |
| Use Case | Intraday, execution | Trend spotting | Trend spotting |
Unlike the SMA or EMA, the vwap indicator is especially valued for execution quality and is widely used by professionals. For a broader look at how these tools fit together, check out this Trading indicators overview.
VWAP vs. On-Balance Volume (OBV) and Other Volume Indicators
The vwap indicator goes beyond just tracking volume trends. OBV, for instance, simply adds or subtracts volume based on price direction, aiming to show accumulation or distribution. While OBV helps spot underlying volume trends, it doesn’t factor in the average price at which most trading happens.
VWAP integrates both price and volume, offering a dynamic line that traders use as a benchmark for fair value during the trading session. In volatile markets, this can make the vwap indicator more reliable than OBV or similar volume-based tools, which may lag or provide ambiguous signals.
In scenarios where volume spikes, VWAP adjusts in real-time, allowing traders to see if the price is trading at a premium or discount to the session’s average. This dual insight gives VWAP a practical edge for both short-term and institutional strategies.
Practical Implications for Traders
How should traders use the vwap indicator in practice? Many combine VWAP with traditional moving averages for confirmation. For example, a price above both VWAP and EMA can signal strong bullish momentum, while a price below both may suggest a bearish trend.
Institutional traders often prioritize the vwap indicator when executing large orders, as it helps minimize market impact and provides a benchmark for trade performance. Retail traders benefit by using VWAP as dynamic support or resistance, filtering out noise from false breakouts.
Ultimately, the vwap indicator can complement or even replace other technical tools in a trading system. By understanding its strengths and limitations, traders can make more informed decisions and adapt strategies to changing market conditions.
Types and Variations of VWAP: Choosing the Right Approach
Navigating the world of trading means finding the right vwap indicator variation to fit your strategy. VWAP isn’t one-size-fits-all—understanding its types and applications can give traders a real edge in today’s fast-moving markets.
Standard, Anchored, and Extended VWAP
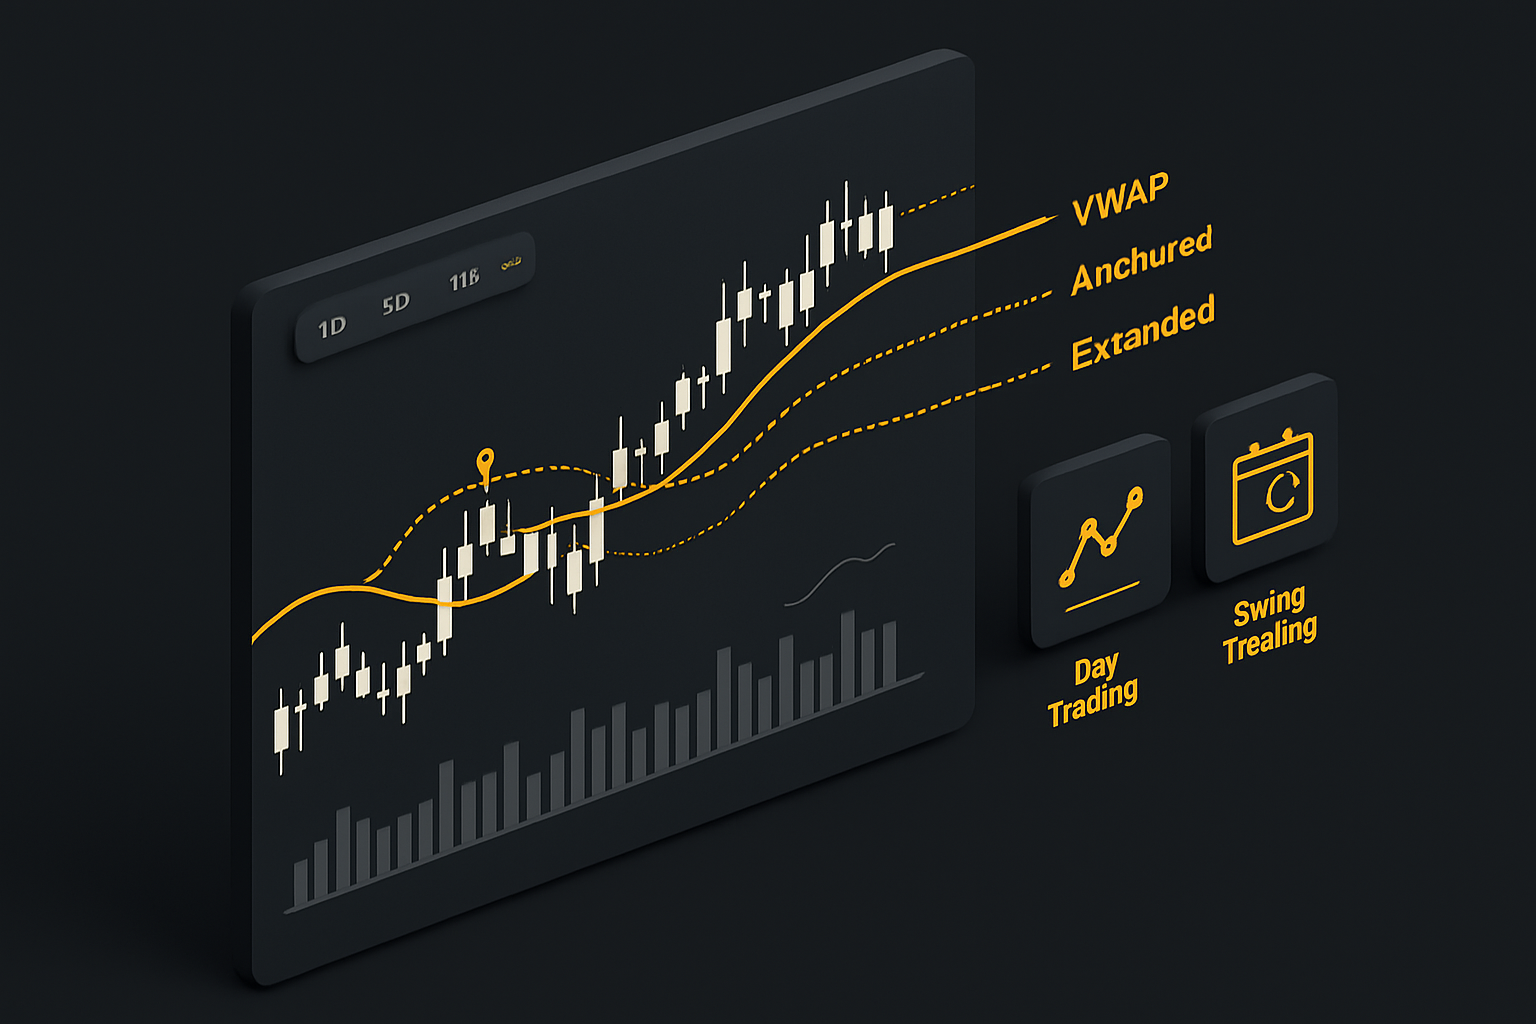
There are three primary forms of the vwap indicator every trader should know:
- Standard VWAP resets at the start of each trading session. It’s perfect for intraday traders who want a fresh benchmark every morning.
- Anchored VWAP lets you “pin” the calculation to a specific event, such as an earnings release or a major price gap. This makes it ideal for analyzing price action from significant market moments.
- Extended VWAP stretches across multiple sessions, offering a broader view for swing or position traders. It helps capture the average price over longer periods, smoothing out daily volatility.
Here’s a quick comparison:
| VWAP Type | Reset Point | Best For |
|---|---|---|
| Standard | Daily open | Intraday trading |
| Anchored | User-chosen event | Event-driven analysis |
| Extended | Multi-session | Swing/position trading |
Choosing the right vwap indicator type is essential for aligning your analysis with your trading timeframe and goals.
Intraday, Multi-Day, and Custom VWAP Applications
The vwap indicator adapts to various trading horizons.
- Intraday VWAP is a favorite for scalpers and day traders. It provides a real-time gauge of fair value, helping pinpoint entries and exits within a single session.
- Multi-Day VWAP looks at average price and volume over several days. Swing traders use this to identify broader trends and confirm market sentiment.
- Custom VWAP settings, available on advanced platforms, allow traders to define unique periods—such as weekly or monthly—for deeper analysis.
These variations make the vwap indicator a flexible tool. For example, a day trader might use intraday VWAP to catch quick bounces, while a swing trader relies on multi-day VWAP to ride larger trends. Custom VWAPs can be anchored to specific news events or market opens for tailored strategies.
Understanding which VWAP application fits your trading style is crucial for maximizing its effectiveness.
Selecting the Optimal VWAP Type for Your Strategy
With so many ways to use the vwap indicator, how do you choose the best fit? Start by considering your trading style:
- Day traders often stick with standard VWAP for clear, session-based signals.
- Swing traders benefit from extended or multi-day VWAP to smooth out noise and spot larger moves.
- Event-driven traders use anchored VWAP to analyze reactions to earnings or economic releases.
Institutional traders frequently anchor VWAP to major market events for precise execution benchmarks. For those interested in advanced setups, pairing VWAP with multi-timeframe trading strategies can add a powerful layer of confirmation and improve trade timing.
Ultimately, the right vwap indicator type should align with your asset class, time horizon, and the nature of your trades. Experiment with different variations and see which delivers the most consistent results in your backtesting and live trading.
Essential VWAP Trading Strategies for 2025
Navigating modern markets in 2025 requires more than just intuition—traders need robust, data-driven tactics. The vwap indicator stands out as a versatile tool for identifying high-probability trades, managing risk, and maximizing returns. In this section, you'll discover essential VWAP strategies, each designed to help you stay ahead in competitive environments.
Support and Resistance Tactics
The vwap indicator often acts as a magnet for price, serving as dynamic support and resistance throughout the trading session. When price approaches the VWAP line from above, it frequently finds support—buyers step in, leading to a potential bounce. Conversely, when price tests VWAP from below, it can act as resistance, prompting sellers to take control.
- Buy setups: Enter long positions when price bounces off VWAP support, especially if accompanied by strong volume.
- Sell setups: Short when price fails at VWAP resistance, confirming a reversal.
- Confirmation: Look for candlestick patterns or additional volume spikes near VWAP for extra validation.
On intraday charts, these bounces are visible as sharp reversals at the VWAP line. This tactic allows traders to enter with tight stop-losses and clear profit targets, making the vwap indicator a reliable guide for both day and swing trading.
Breakout and Trend-Following Methods
Breakout strategies using the vwap indicator are favorites among active traders in 2025. When price sustains a move above VWAP with increased volume, it signals bullish momentum and a possible uptrend. The opposite holds true for breakdowns below VWAP, indicating bearish sentiment.
- Entry: Go long on strong closes above VWAP, with confirmation from rising volume.
- Exit: Take profits near key resistance or when price loses VWAP support.
- Shorting: Enter short trades on confirmed breakdowns below VWAP with heavy selling volume.
This method filters out false moves, as genuine breakouts usually coincide with aggressive volume. Combining the vwap indicator with trend-following tools helps traders catch major moves while avoiding choppy market noise.
Mean Reversion and Pullback Plays
Markets rarely move in straight lines. The vwap indicator helps traders spot when prices have strayed too far from the average, setting up mean reversion trades. Research shows that in over 70% of intraday sessions, price tends to revert back to VWAP after extended moves.
- Identify extremes: Watch for price deviations of 1-2% or more from VWAP.
- Entry: Fade the move when momentum wanes, targeting a return to the VWAP line.
- Exit: Book profits as price converges with VWAP, or if momentum resumes.
This approach is especially useful for scalpers and short-term traders seeking quick, reliable setups. The vwap indicator acts as a gravity center, pulling price back after unsustainable surges.
Volume Confirmation and Trade Filtering
Volume is the lifeblood of any market move. The vwap indicator becomes even more effective when paired with volume analysis for trade confirmation and filtering. A breakout above VWAP with low volume often fizzles, while a surge with high volume tends to stick.
- Confirm direction: Only take trades in the direction of VWAP when accompanied by above-average volume.
- Filter noise: Avoid false breakouts and whipsaws by requiring price and volume alignment with VWAP.
- Example: If price crosses above VWAP but volume is muted, stand aside.
For those seeking advanced insights, research on Improving VWAP Strategies: A Dynamic Volume Approach demonstrates how modeling intraday volume can reduce execution risk and sharpen trade selection with the vwap indicator.
Stop-Loss and Take-Profit Placement Using VWAP
Effective trade management hinges on precise stop-loss and take-profit placement. The vwap indicator gives traders a logical framework for setting these levels.
- Long setups: Place stops just below VWAP to limit downside; trail stops higher as price moves up.
- Short setups: Set stops just above VWAP for protection; trail lower as price falls.
- Profit-taking: Target exits at key pivots, or as price approaches the opposite VWAP band.
This disciplined approach keeps risk tightly controlled while letting profits run, all guided by the vwap indicator’s real-time feedback.
Multi-Timeframe VWAP Integration
Analyzing the vwap indicator across multiple timeframes unlocks deeper market context and higher-probability trades. For example, a bullish setup is stronger when both the 5-minute and daily VWAPs align above price.
- Combine: Watch for confluence between intraday and higher timeframe VWAPs.
- Filter: Only trade when both timeframes confirm the trend direction.
- Example: Enter long if price is above intraday VWAP and daily VWAP is also trending up.
Multi-timeframe analysis helps filter out noise and ensures that your trades align with the broader market structure, increasing the effectiveness of the vwap indicator.
Risk Management and VWAP
Smart traders use the vwap indicator as a cornerstone of risk management. By benchmarking trades against VWAP, you can objectively assess execution quality and avoid emotional decision-making.
- Review: Analyze trade entries and exits relative to VWAP in your trading journal.
- Adjust: Refine strategy parameters as markets evolve and liquidity shifts.
- Adapt: Use VWAP to gauge whether your fills are favorable compared to the session average.
Consistent use of the vwap indicator fosters disciplined trading, helping you avoid costly mistakes and improve long-term performance. In 2025, integrating advanced volume models, as highlighted in recent research, can further refine your risk controls and boost confidence in every trade.
Advanced VWAP Techniques and Tools for Modern Traders
Modern traders are always searching for ways to amplify the power of the vwap indicator. To stay ahead in 2025, it’s crucial to master a suite of advanced VWAP techniques and leverage innovative tools. Let’s explore how to unlock the full potential of the vwap indicator with a blend of time-tested and cutting-edge strategies.
Combining VWAP with Other Indicators
One of the most effective ways to enhance the vwap indicator is by pairing it with complementary tools. For instance, combining VWAP with RSI helps traders spot overbought and oversold zones near the VWAP line. When both indicators signal a reversal, the probability of a strong move increases.
MACD is another favorite for trend confirmation. A MACD crossover above or below the vwap indicator often signals a high-conviction trend shift. For a deeper dive into this powerful combination, see the MACD indicator guide. Many traders also overlay Bollinger Bands to visualize volatility around VWAP, which helps in timing entries or exits when price stretches far from the average.
- Pair VWAP with RSI for reversal signals
- Use MACD with VWAP for trend confirmation
- Overlay Bollinger Bands for volatility context
When these indicators align with the vwap indicator, traders gain robust, multi-dimensional signals.
VWAP Divergence and Market Reversals
VWAP divergence occurs when price trends in one direction while the vwap indicator moves in another. This divergence often reveals weakening momentum, signaling a potential reversal.
For example, if the price continues to rise but the vwap indicator starts to flatten or decline, it may indicate buyers are losing control. Conversely, falling prices with a rising VWAP can signal seller exhaustion. Identifying these divergences early can help traders anticipate market turning points and position themselves ahead of the crowd.
- Bullish divergence: Price down, VWAP up
- Bearish divergence: Price up, VWAP down
Spotting divergence with the vwap indicator is a valuable skill for catching major reversals.
Volume Profile Analysis with VWAP
Advanced traders often combine the vwap indicator with volume profile analysis to pinpoint high-activity price zones. The volume profile maps where the most trading has occurred, while VWAP highlights the average price weighted by volume.
When the vwap indicator aligns with a high-volume node, it often marks a strong support or resistance level. This combination helps traders identify hidden zones where price is likely to react, adding a layer of precision to entries and exits.
- Identify high-activity price levels
- Spot hidden support and resistance zones
- Refine trade timing with volume and VWAP alignment
Using the vwap indicator with volume profile gives traders a powerful edge in reading market structure.
Algorithmic and Institutional VWAP Strategies
The vwap indicator is a staple for institutions and algorithmic traders aiming for optimal execution. Algorithms often split large orders into smaller chunks, executing them at prices close to VWAP to minimize market impact.
Institutions use the vwap indicator as a benchmark for trade execution quality. If trades fill near or better than VWAP, it signals strong execution. Many algorithmic strategies are built around tracking and responding to the vwap indicator, especially in high-frequency and programmatic trading.
- Break up large orders to match VWAP
- Benchmark execution with VWAP
- Automate trade flows for consistency
Mastering the vwap indicator is essential for traders looking to emulate institutional-grade execution.
AI-Powered VWAP Signal Solutions: The Role of PipTrend
AI is reshaping how traders harness the vwap indicator. PipTrend stands out as an AI-powered tool that delivers real-time buy and sell signals, working seamlessly across stocks, forex, and crypto. Its smart trend detection and multi-timeframe analysis are designed to amplify VWAP-based strategies.
With instant alerts, customizable settings, and TradingView integration, PipTrend helps traders act on VWAP signals with speed and confidence. AI-driven insights reduce guesswork and filter out noise, key for maintaining consistency with the vwap indicator in volatile markets.
- Real-time, AI-powered signals
- Multi-timeframe VWAP analysis
- Customizable alerts and platform integration
Combining the vwap indicator with AI solutions like PipTrend gives modern traders a decisive edge for 2025.
Implementing VWAP in Your Trading: Step-by-Step Guide
Ready to put the vwap indicator to work in your trading? This step-by-step guide breaks down exactly how to implement VWAP for actionable, disciplined results. Whether you’re new to VWAP or looking to refine your approach for 2025, follow these steps to integrate this powerful tool into your process.
Step 1: Select the Appropriate VWAP Type and Timeframe
The first step is choosing which vwap indicator variant matches your trading style. Are you a day trader? Standard, session-based VWAP is ideal. Prefer swing trades? Multi-day or anchored VWAP helps you track price and volume after key events.
Consider your asset class too. Stocks, forex, and crypto may each respond differently to VWAP periods. For intraday scalps, a daily VWAP offers clarity. For longer-term swings, extended or anchored VWAP can reveal deeper trends.
Make this decision before you move on. The right VWAP type ensures your analysis starts on solid ground.
Step 2: Set Up VWAP on Your Trading Platform
Most platforms make adding the vwap indicator easy. On TradingView, search “VWAP” in the indicator list and apply it to your chart. MetaTrader and Thinkorswim offer similar options.
Once added, customize the VWAP line for visibility. Adjust color and thickness so it stands out. Some platforms let you add VWAP bands—standard deviations above and below the main line—for extra context.
If you trade multiple assets, save your VWAP setup as a template. This saves time and ensures consistency across charts.
Step 3: Combine VWAP with Complementary Indicators
The vwap indicator is powerful, but pairing it with other tools increases your edge. Try adding momentum indicators like RSI or MACD for trend confirmation. Volume tools help verify if price moves are supported by strong participation.
For advanced analysis, consider combining VWAP with Bollinger Bands explained to spot volatility squeezes or reversals. This multi-layered approach helps filter out noise and highlights only the most promising setups.
Experiment with different indicator combos until you find what fits your style best.
Step 4: Develop and Test VWAP-Based Trade Setups
With the vwap indicator on your charts, it’s time to define your entry and exit rules. Will you buy pullbacks to VWAP? Trade breakouts above it? Write down your criteria for taking trades.
Backtest these ideas using historical data. Many platforms have built-in backtesting tools. For deeper insight, consult academic research like the Volume-Weighted Average Price Tracking Study to understand how VWAP-based strategies perform under different market conditions.
Don’t skip paper trading. Test your rules in a simulated environment before risking real capital.
Step 5: Execute and Manage Trades with VWAP Guidance
When you’re ready to go live, let the vwap indicator guide your execution. Monitor price action as it interacts with VWAP—does it bounce, break, or consolidate? Use VWAP as a dynamic reference for stop-loss and take-profit placement.
Adjust your position sizing and risk parameters based on VWAP proximity. For example, if price is extended far from VWAP, consider scaling out or tightening stops.
Active management keeps you in sync with market flow and helps you avoid emotional decisions.
Step 6: Review and Optimize VWAP Strategy Performance
After each session, review your trades through the lens of the vwap indicator. Did your entries align with VWAP signals? Were there false breakouts or missed opportunities?
Maintain a detailed trading journal. Record outcomes, screenshots, and notes on what worked or didn’t. Periodically adjust your VWAP settings or strategy rules based on your findings.
For advanced optimization, explore new research like Deep Learning for VWAP Execution in Crypto Markets to see how AI and machine learning are enhancing VWAP-based execution, especially in volatile environments.
Step 7: Stay Informed on Market Developments Impacting VWAP
The markets are always changing, so adapt your use of the vwap indicator accordingly. Stay updated on economic news, market events, and shifts in liquidity that can impact VWAP reliability.
Different assets may require different VWAP parameters. Stocks, crypto, and futures each have unique trading rhythms. Adjust your approach as needed and re-test your setups when market conditions shift.
Continuous learning ensures your VWAP strategy remains effective as you move into 2025 and beyond.
Limitations and Considerations When Using VWAP
Trading with the vwap indicator offers many advantages, but it’s important to recognize its constraints. Understanding these limitations helps traders avoid common pitfalls and use VWAP more effectively in real-time markets.
VWAP as a Lagging Indicator
The vwap indicator relies on historical price and volume data to calculate its position. As a result, it tends to lag behind sudden market moves, especially during high volatility. This lag can delay entry or exit signals, making it less responsive in fast-moving environments.
For traders who depend on real-time reactions, understanding this lag is crucial. The vwap indicator works best when combined with other tools that can help anticipate price action.
Reliability in Low-Volume and Illiquid Markets
In low-volume or illiquid markets, the vwap indicator can be distorted by a few large trades. When trading thinly traded stocks or assets, a single transaction can pull the VWAP line away from the true average price.
This unreliability may lead to false signals and reduce the indicator’s effectiveness. Always check the liquidity of an asset before relying solely on the vwap indicator for decision-making.
Daily Reset and Time Sensitivity
One unique aspect of the vwap indicator is its daily reset. Standard VWAP recalculates at the start of each trading session, which means it’s primarily a short-term reference.
This daily reset limits its usefulness for swing traders or those holding positions overnight. If you need insights across multiple days, consider using anchored or multi-session VWAP variations.
Not Predictive: VWAP as a Reference, Not a Forecast
The vwap indicator is not designed to predict future price direction. Instead, it reflects the average price paid, weighted by volume, over a specific period.
Relying solely on VWAP for forecasts can be misleading. Use the vwap indicator as part of a broader strategy that includes trend analysis and other confirmation tools.
Market-Specific Behavior and Adaptation
VWAP doesn’t behave identically across all markets. Stocks, forex, futures, and crypto each have unique volume patterns and trading hours.
Adjust your vwap indicator settings and strategies to fit the asset class. For example, crypto markets run 24/7, requiring custom VWAP periods, while stocks have defined sessions.
Practical Tips for Maximizing VWAP Effectiveness
To get the most from the vwap indicator, combine it with robust risk management and supplementary analysis. Here are a few key tips:
- Pair VWAP with moving averages or momentum indicators for confirmation.
- Always monitor liquidity and avoid over-relying on VWAP in thin markets.
- Adjust VWAP parameters for different assets and trading styles.
- Keep a trading journal to track VWAP-based trade performance.
Remember, no indicator guarantees success. Use the vwap indicator as a reference point, not a standalone solution.
Now that you’ve got a solid grip on how VWAP can transform your trading strategy for 2025, why not put these insights into action with the right tools by your side? With PipTrend’s AI-powered signals and real-time alerts, you can take the guesswork out of your trades and focus on making confident, informed decisions—no matter the market. If you’re ready to see what a smarter, data-driven approach can do for your results, See Your Trading Improve With PipTrend. Let’s make your next trade your best one yet!