
In the fast-evolving world of trading, having the best indicators for trading can make the difference between consistent profits and missed opportunities. As markets become more complex and technology continues to advance, traders need tools that offer clarity, accuracy, and adaptability.
This article explores the top 7 best indicators for trading in 2026, empowering you to stay ahead of market shifts. We will cover trend-following, momentum, volatility, and AI-powered solutions, each paired with practical use cases to help you make informed decisions.
Get ready to discover actionable insights, leverage the latest advancements, and elevate your trading results by exploring the most effective indicators available today.
Understanding Trading Indicators in 2026
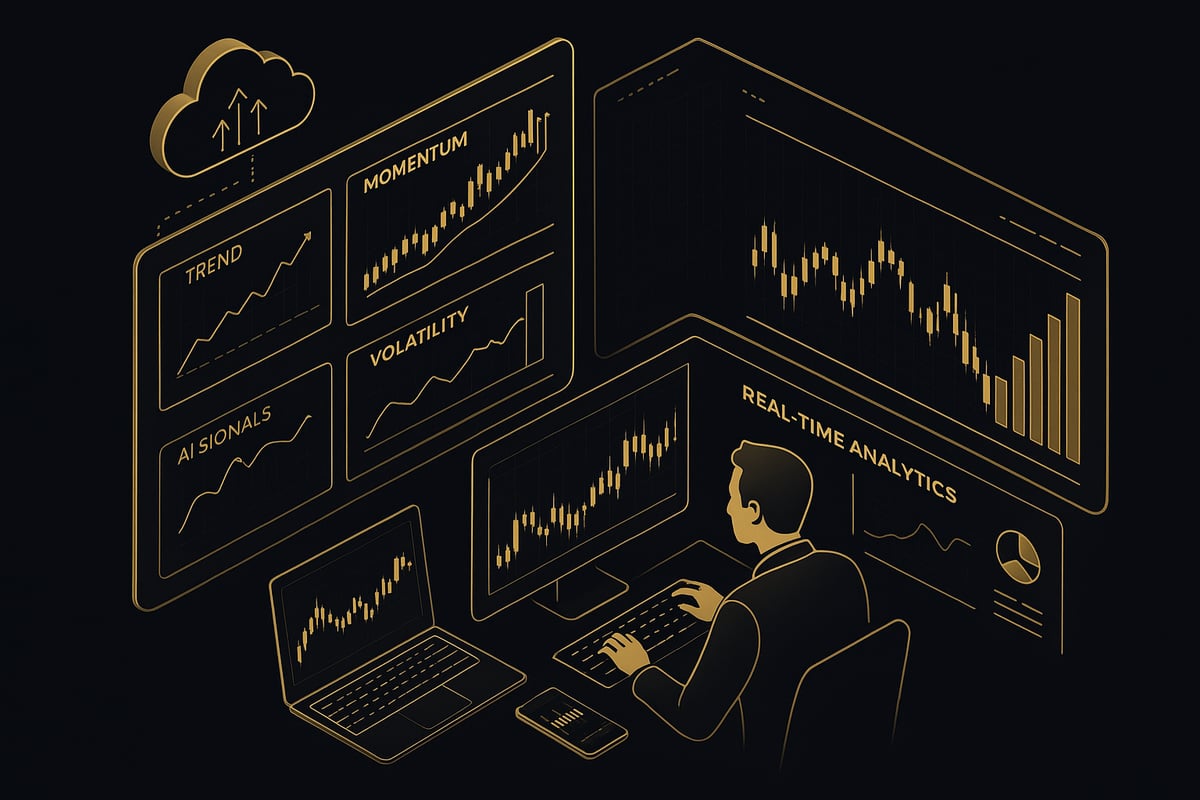
Trading in 2026 is more dynamic than ever, and understanding the best indicators for trading is essential for anyone aiming to stay ahead. As markets become more complex, traders need tools that adapt quickly and deliver actionable insights. The evolution of indicators is making it possible to cut through market noise and seize high-quality opportunities with confidence.
 Trading Indicators in 2026">
The Evolving Role of Trading Indicators
Over recent years, the role of trading indicators has shifted dramatically. Markets are now shaped by high-frequency trading and advanced algorithms, requiring indicators to process vast amounts of real-time data. Artificial intelligence and machine learning are increasingly embedded in modern tools, enhancing the accuracy and speed of signals.
Today's indicators are expected to integrate seamlessly across platforms, from desktop terminals to mobile apps. Traders demand actionable, noise-filtered signals that help them avoid false moves and capitalize on genuine opportunities. For example, AI-powered indicators can analyze multi-asset classes, filter out irrelevant data, and adapt to shifting market conditions almost instantly.
With the surge in algorithmic and AI-driven trading, adoption rates have soared. According to industry statistics, algorithmic trading now accounts for a significant share of global trading volume. This evolution highlights why identifying the best indicators for trading is more crucial than ever for both retail and professional traders.
Types of Trading Indicators: A Quick Overview
Trading indicators fall into several core categories, each serving a unique role. Trend-following indicators, such as moving averages, help traders identify the primary market direction. Momentum indicators, like the Relative Strength Index (RSI), measure the speed and strength of price movements. Volatility tools, including Bollinger Bands, gauge market fluctuations, while volume-based indicators like VWAP reveal institutional activity.
A key distinction exists between leading and lagging indicators. Leading indicators try to predict price movement, while lagging ones confirm trends after they begin. Many traders seek confluence by combining different indicators to strengthen their analysis and reduce risk.
Adaptability is essential, as the best indicators for trading must function across asset classes, including forex, stocks, crypto, and commodities. For instance, a trader might pair MACD with RSI for momentum trades, or use Bollinger Bands alongside VWAP for volatility-based strategies. This flexibility allows for more strategic, evidence-based decisions.
What Makes an Indicator “Best” in 2026?
To qualify as one of the best indicators for trading in 2026, a tool must meet several key criteria. Accuracy and responsiveness are paramount, ensuring traders receive timely and reliable signals. Ease of use and a user-friendly interface are essential, especially as more retail traders enter the market. Multi-timeframe analysis and compatibility with various platforms enable traders to monitor positions across devices.
Customization options and institutional-level features are increasingly demanded by retail users, narrowing the gap between professional and individual traders. The ability to minimize false signals and reduce lag is critical for maintaining an edge.
Backtesting, robust community support, and regular updates further enhance an indicator's value. For a deeper dive into what sets top-performing tools apart, see the Best Trading Indicators Guide, which offers comprehensive insights and practical use cases. A typical workflow might involve a trader setting up alerts, backtesting strategies, and refining their approach based on real-time feedback and peer input.
Top 7 Best Indicators for Trading in 2026
In 2026, traders have access to a wide range of sophisticated tools that can sharpen their edge in the markets. The best indicators for trading combine cutting-edge technology, clear signals, and user-friendly features to help traders navigate volatility and capture opportunities. Below, we detail the top 7 best indicators for trading, highlighting their unique strengths and practical applications.
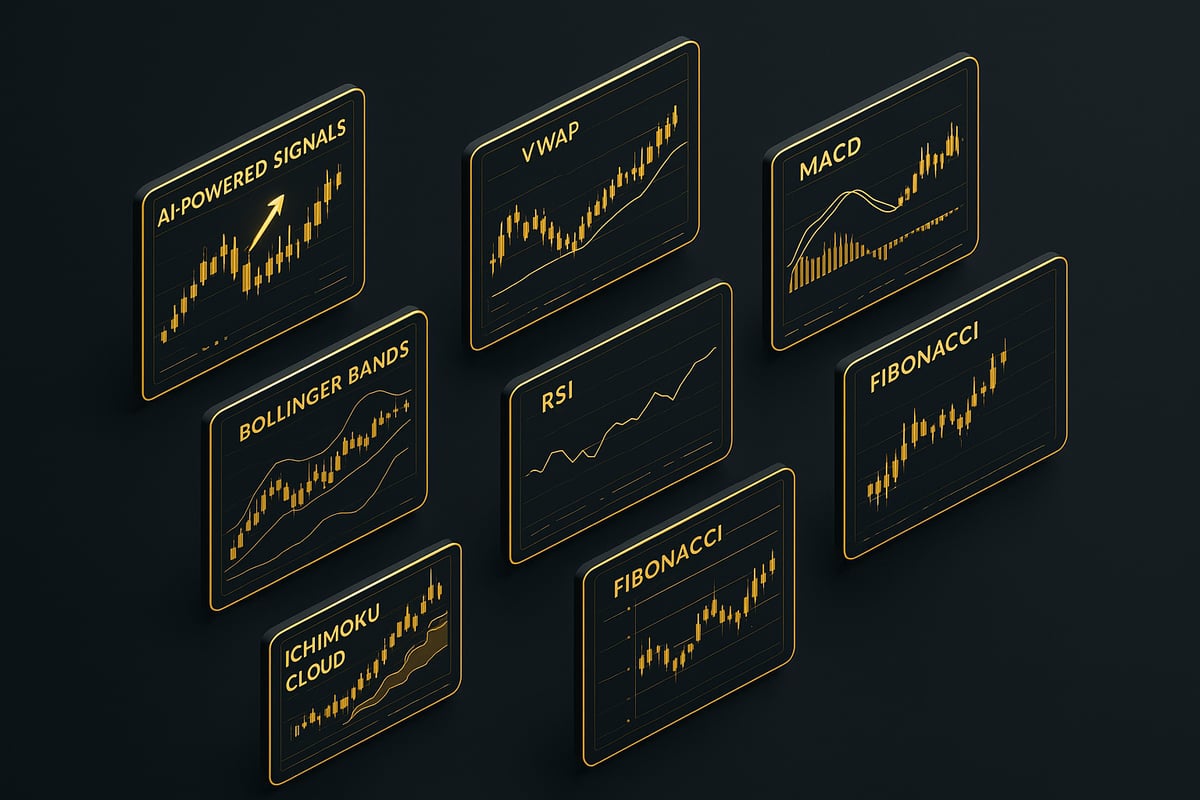
1. PipTrend AI Trading Indicator Suite
The PipTrend AI Trading Indicator Suite stands out as one of the best indicators for trading in 2026 thanks to its real-time, AI-driven signals. Designed for TradingView, it automatically detects trends and aligns multiple timeframes, giving traders instant clarity in all major markets, including forex, crypto, stocks, indices, and commodities.
Key features include customizable alerts, multi-timeframe trend confidence, and institutional-level timing. The suite’s lifetime updates, 3-day free trial, and 30-day refund policy make it appealing for both retail and professional traders. Pricing is tiered at $59.99 per month, $134.99 per quarter, and $479.99 per year.
Benefits:
- Eliminates guesswork by filtering out low-quality setups.
- Provides instant, actionable signals for day and swing traders.
- Offers 24/7 human support and access to an exclusive trading community.
Drawbacks:
- Requires an active TradingView account.
- Subscription-based pricing model.
A practical example shows how PipTrend helps prevent overtrading by highlighting only high-probability opportunities. This focus on quality over quantity is essential for those seeking the best indicators for trading, especially beginners and intermediates aiming for consistency.
2. Volume Weighted Average Price (VWAP)
VWAP is a cornerstone among the best indicators for trading, especially for intraday strategies. It calculates the average price weighted by volume, dynamically updating throughout the trading session.
Features include real-time recalculation, dynamic support and resistance, and broad compatibility across trading platforms. VWAP is ideal for day traders, scalpers, and those trading high-volume assets, as it helps pinpoint the true direction of institutional flows.
Benefits:
- Reliable confirmation for intraday trends.
- Easy to interpret, reducing market noise.
- Trusted by institutional traders for order execution.
Drawbacks:
- Less effective in low-volume or highly volatile markets.
- Primarily designed for intraday use.
A typical use case involves confirming entry points during the US session. Statistics show that over 70% of institutional traders use VWAP as a benchmark, reinforcing its status among the best indicators for trading.
3. Moving Average Convergence Divergence (MACD)
MACD remains a favorite in discussions of the best indicators for trading, blending two exponential moving averages to reveal momentum and trend direction. With its MACD line, signal line, and histogram, traders can easily spot shifts in market momentum.
Features:
- Visual representation of momentum changes.
- Identifies trend reversals and entry/exit points.
- Works across multiple assets and timeframes.
Benefits:
- Versatile and easy to understand.
- Provides clear cues for swing and trend traders.
- Suitable for beginners and professionals alike.
Drawbacks:
- May lag in fast-moving markets.
- Can produce false signals in choppy conditions.
For example, spotting bullish divergence in crypto can signal an early trend reversal. For a deeper dive, see this Moving Average Convergence Divergence (MACD) resource. According to competitor research, MACD consistently ranks in the top three most-used tools, underscoring its value as one of the best indicators for trading.
4. Bollinger Bands
Bollinger Bands are synonymous with volatility trading and are considered among the best indicators for trading when markets are ranging or preparing for a breakout. They consist of a moving average with dynamic upper and lower bands based on standard deviation.
Features:
- Squeeze detection for volatility contraction.
- Customizable period and band width.
- Real-time adaptation to changing volatility.
Benefits:
- Identifies overbought and oversold conditions.
- Signals potential breakouts after periods of low volatility.
- Suitable for forex, crypto, and equities.
Drawbacks:
- May produce false signals in strong trends.
- Requires confirmation from other indicators.
A common strategy involves watching for a Bollinger Band “squeeze,” which often precedes major price movements. Many traders pair Bollinger Bands with momentum tools for more reliable signals, cementing their role among the best indicators for trading.
5. Relative Strength Index (RSI)
The Relative Strength Index (RSI) is a momentum oscillator that measures the speed and change of price movements on a 0-100 scale. It’s one of the best indicators for trading reversals and assessing trend strength.
Features:
- Customizable period, typically set to 14.
- Overbought (70) and oversold (30) thresholds.
- Divergence detection for early warning signals.
Benefits:
- Simple and intuitive for timing entries and exits.
- Effective for both swing traders and reversal strategies.
- Widely supported across all trading platforms.
Drawbacks:
- Can remain in extreme zones during strong trends.
- Works best when combined with other indicators.
A classic RSI divergence can signal a reversal before a major rally in equities or crypto. Industry analysis shows that RSI is referenced in over 60% of technical trading strategies, confirming its place among the best indicators for trading.
6. Ichimoku Cloud
Ichimoku Cloud offers a comprehensive view of price action, making it one of the best indicators for trading trends and momentum. This all-in-one tool displays trend direction, potential support and resistance, and momentum signals through its cloud (Kumo), conversion and base lines, and lagging span.
Features:
- Multi-timeframe analysis.
- Visual trend confirmation using the cloud.
- Multiple actionable signals in a single view.
Benefits:
- Holistic market perspective.
- Strong for confirming trend direction and reversals.
- Increasingly popular among algorithmic and retail traders.
Drawbacks:
- Complex for beginners due to multiple components.
- Requires practice to interpret signals effectively.
For instance, trading pullbacks within the cloud can yield low-risk entries in trending forex pairs. As more traders seek comprehensive tools, Ichimoku Cloud’s reputation as one of the best indicators for trading continues to grow.
7. Fibonacci Retracement Levels
Fibonacci Retracement Levels are a staple for planning trades around key support and resistance zones. As part of the best indicators for trading, they utilize Fibonacci ratios (23.6%, 38.2%, 50%, 61.8%, 78.6%) to identify potential turning points after strong price moves.
Features:
- Plots retracement levels on any timeframe.
- Works across all asset classes.
- Helps set stop-loss and profit targets.
Benefits:
- Simple to apply and widely recognized.
- Effective in both trending and corrective markets.
- Enhances trade planning and risk management.
Drawbacks:
- Placement can be subjective.
- Needs confirmation from other indicators for higher accuracy.
A popular approach is entering trades near the 61.8% retracement following a strong move. Over 50% of professional trading education materials reference Fibonacci, confirming its status among the best indicators for trading.
Quick Comparison Table
| Indicator | Key Feature | Best For | Pros | Cons |
|---|---|---|---|---|
| PipTrend AI | AI-powered, multi-timeframe | All markets | Real-time, filtered signals | Requires TradingView |
| VWAP | Volume-weighted average | Intraday, high volume | Reliable for institutions, easy to use | Intraday focus |
| MACD | Momentum & trend analysis | Swing, multi-asset | Versatile, clear cues | Lagging in fast markets |
| Bollinger Bands | Volatility measurement | Breakouts, ranges | Adapts to volatility, squeeze detection | False signals in trends |
| RSI | Momentum oscillator | Reversals, swing | Simple, effective, widely available | Stays extreme in trends |
| Ichimoku Cloud | Comprehensive view | Trend, forex, index | Holistic, multi-signal | Complex for beginners |
| Fibonacci | Retracement levels | Trend, swing | Simple, effective, multi-asset | Subjective placement |
These seven tools represent the best indicators for trading in 2026, offering a blend of tradition and innovation to help traders stay ahead of market shifts.
How to Choose the Right Trading Indicators for Your Strategy
Selecting the best indicators for trading can transform your strategy, but the process requires careful consideration of your unique goals, market focus, and preferred style. By understanding your needs and applying smart combinations, you can create a toolkit that gives you an edge in any market environment.
Assessing Your Trading Style and Goals
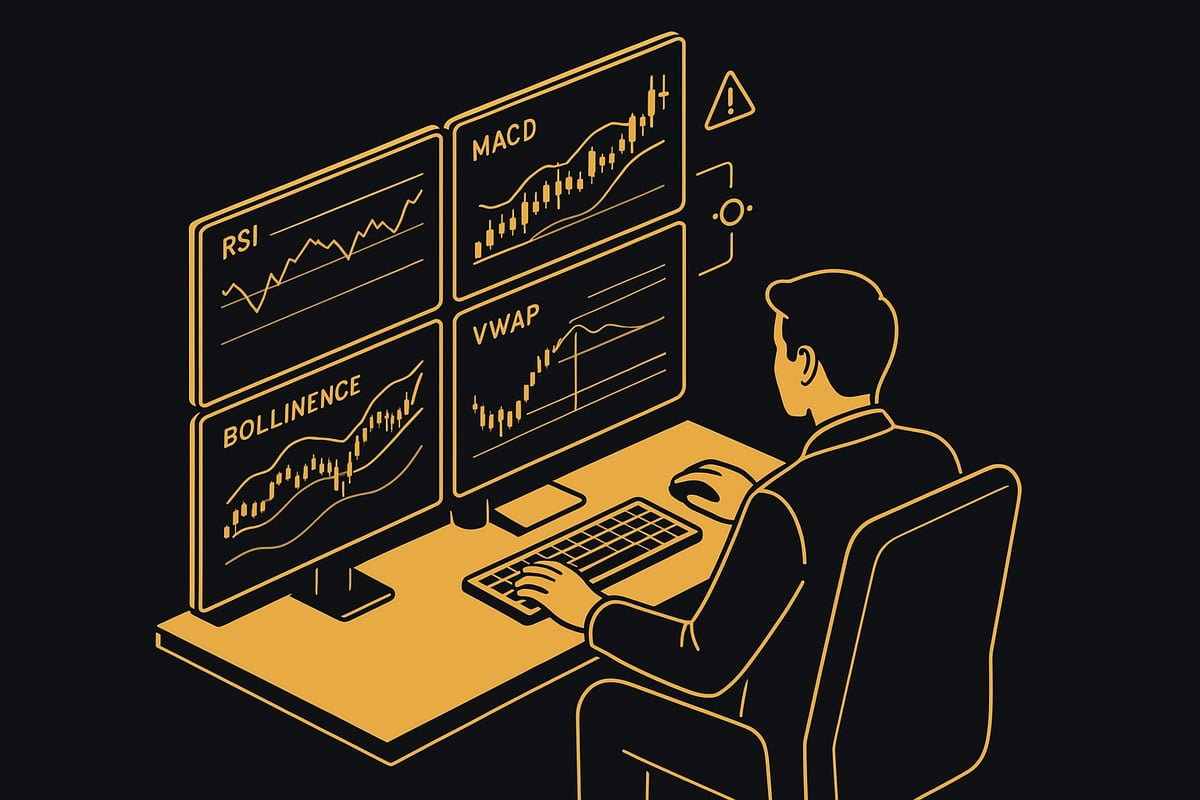
The first step in finding the best indicators for trading is to define your trading style and objectives. Are you a day trader seeking quick moves, a swing trader targeting larger trends, or a long-term investor focusing on macro shifts? Your approach will influence which indicators fit best.
Scalpers often rely on fast-reacting tools like VWAP and short-period oscillators for rapid decisions. Swing traders might prefer the MACD for trend confirmation and Fibonacci retracement for pinpointing entry zones. If your focus is on equities, you may combine volume-based indicators with momentum tools, while crypto traders often prioritize volatility measures.
Risk tolerance also plays a crucial role. Conservative traders may stick to tried-and-true signals, while aggressive traders experiment with newer, AI-powered options. Matching your risk appetite and trading frequency to the right tools is foundational to long-term success.
Combining Indicators for Maximum Effectiveness
To maximize the value of the best indicators for trading, use the principle of confluence. This means combining two or more indicators that complement each other, providing stronger and more reliable signals. For example, pairing MACD with RSI can help confirm momentum shifts, while combining Bollinger Bands and VWAP offers insight into volatility and fair value.
However, avoid indicator overload. Too many signals can create confusion and lead to conflicting advice. Focus on a few core tools that work well together. For more on how different indicators function and interact, you can visit the Technical Analysis Indicators Overview.
Before applying any setup in a live market, backtest your combinations thoroughly. This ensures your chosen indicators align with your strategy and market conditions, reducing the risk of costly errors.
Practical Tips for Implementation in 2026
Implementing the best indicators for trading in 2026 means leveraging modern platforms that support customization and AI integration. Start with one or two core indicators, such as RSI or MACD, and expand your toolkit as you gain confidence. Utilize alert systems and automation features to minimize manual monitoring and streamline your workflow.
Community feedback and ongoing education are invaluable. Many traders join online groups to share experiences and optimize strategies. For instance, a trader using a standard set of indicators switched to AI-powered, multi-timeframe tools and saw a measurable improvement in win rate and consistency. If you want to refine your use of RSI, explore specialized resources like Relative Strength Index Insights for deeper guidance.
Regularly review and adjust your indicator settings as market conditions evolve. With a thoughtful approach, clear strategy, and the right mix of tools, you can maximize the power of the best indicators for trading and stay ahead in the dynamic markets of 2026.
Future Trends in Trading Indicators
As the landscape of trading evolves, the best indicators for trading are adapting rapidly to meet new demands. The future of trading indicators is being shaped by breakthroughs in AI, a move toward seamless cross-platform experiences, and a surge in community-driven customization. Let us explore the trends that will define how traders choose and use the best indicators for trading in the years ahead.
AI and Machine Learning in Indicator Development
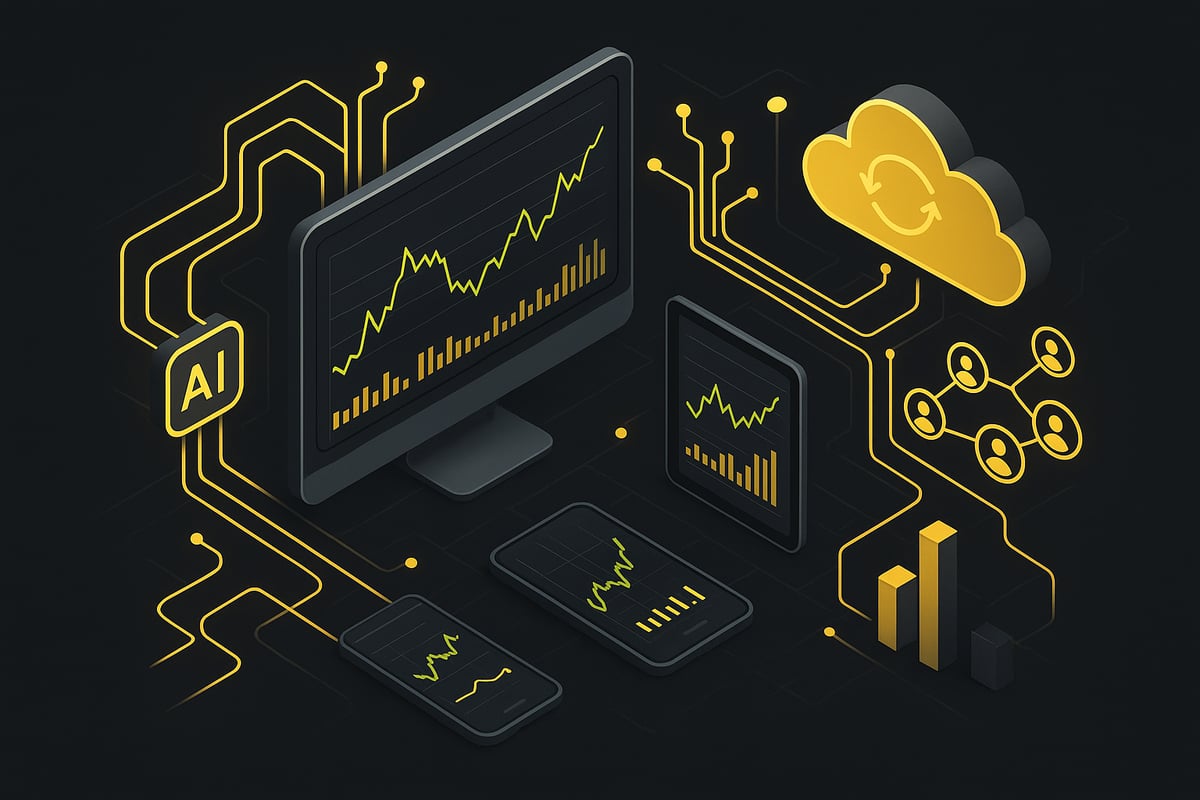
Artificial intelligence is transforming how the best indicators for trading are designed and deployed. Modern indicators now harness machine learning to analyze massive datasets, adapting to market shifts faster than traditional tools. These AI-driven solutions deliver more accurate, noise-filtered signals, boosting trader confidence and performance.
A growing number of platforms are launching AI-powered indicators that learn from historical data and adjust in real time. As highlighted in the AI in Financial Markets Report, AI adoption in financial tools is accelerating, with traders reporting measurable improvements in signal precision and adaptability. As a result, the best indicators for trading are becoming smarter and more responsive, setting a new standard for market analysis.
Cross-Platform and Mobile Integration
Accessibility is now a top priority for the best indicators for trading. Traders expect seamless access to their favorite tools across desktop, web, and mobile devices. Platforms are responding by offering cloud-based storage, API integrations, and synchronized indicator settings, making it easy to monitor positions and signals anywhere.
According to Mobile Trading Platform Trends, there is a significant shift toward mobile-first solutions, enabling traders to react instantly to market changes. This evolution ensures that the best indicators for trading are always at your fingertips, whether you are at your desk or on the move.
Community, Customization, and Social Trading
Community-driven innovation is redefining the best indicators for trading. Traders are increasingly collaborating to develop and share custom scripts, optimizing strategies for unique market conditions. Open-source platforms and indicator marketplaces have surged in popularity, making it easier than ever to access, modify, and test new tools.
Key trends in this space include:
- Customizable indicators: Users can tailor parameters and visuals to match their strategy.
- Social trading features: Follow, copy, or learn from other successful traders.
- Marketplace growth: Access thousands of user-generated indicators and strategies.
These developments empower both new and experienced traders to stay ahead of the curve. With regular feedback and shared expertise, the best indicators for trading continue to evolve, backed by a vibrant and supportive community.
As you’ve seen throughout this guide, having the right indicators can transform your trading—bringing clarity, confidence, and consistency in a fast-moving market. Whether you’re refining your approach or stepping up to more advanced tools, the right suite can mean fewer second-guesses and more conviction in every trade. If you’re ready to experience real-time, AI-powered signals that cut through the noise and help you spot high-probability setups, it’s time to See Your Trading Improve With PipTrend. Take the next step toward smarter, more decisive trading and make your strategy work for you in 2026.