
As financial markets grow more complex and volatile heading into 2026, traders face new challenges and opportunities every day. Gaining an edge now requires more than intuition or guesswork. The best technical indicator for trading can be the difference between consistent profits and costly mistakes.
In this article, we reveal the seven essential technical indicators that have proven their worth, offering effectiveness, reliability, and adaptability for the evolving market landscape. You will discover each indicator’s core features, practical use cases, pros and cons, and what makes them uniquely powerful for 2026. Ready to elevate your trading strategy and outperform the competition? Let’s dive in.
Understanding Technical Indicators: The Foundation of Smart Trading
Navigating the markets in 2026 demands a deeper understanding of what sets the best technical indicator for trading apart from the rest. Technical indicators are the backbone of data-driven trading, offering clarity and structure in uncertain environments. By mastering how these tools work and evolve, traders can make informed decisions that withstand rapid market changes.
What Are Technical Indicators and Why Do They Matter?
Technical indicators are mathematical calculations based on price, volume, or open interest that help traders analyze financial markets. They play a crucial role in identifying patterns, trends, and momentum, allowing traders to anticipate future price movements more accurately.
There are two main types: leading indicators, which signal potential trend reversals before they occur, and lagging indicators, which confirm trends after they have started. By combining both, traders can spot optimal entry and exit points with greater confidence.
For example, in a recent survey, over 85% of active traders reported that technical indicators were integral to their strategies. A swing trader using the best technical indicator for trading, such as RSI divergence, successfully captured a major reversal in the S&P 500. For a deeper dive, explore the Best technical indicators for trading to understand how these tools power decision-making.
How to Evaluate the Best Technical Indicators for 2026
Selecting the best technical indicator for trading requires a focus on several key criteria. Accuracy is paramount, as reliable signals reduce costly mistakes. Adaptability ensures the indicator can adjust to different markets and timeframes. Ease of use matters, especially for traders balancing multiple strategies. Integration with platforms like TradingView or MetaTrader streamlines workflow.
Backtesting is essential for validating an indicator’s effectiveness with historical data, supporting data-driven decisions. The rise of AI and automation has further transformed indicator development, enabling more dynamic responses to market shifts.
However, traders should avoid common pitfalls like overfitting strategies to past data, using redundant indicators that offer similar signals, or misinterpreting outputs. Versatile indicators that operate across forex, stocks, and crypto are especially valuable for 2026.
Key Trends Shaping Technical Indicator Development
Recent years have seen a surge in AI-powered and machine learning-based indicators, redefining what qualifies as the best technical indicator for trading. These advanced tools can process massive data streams in real time, uncovering subtle patterns that traditional indicators may overlook.
Traders now demand multi-timeframe analysis, allowing them to align short-term and long-term signals for higher accuracy. Seamless integration with trading platforms, combined with customizable alerts, has made technical analysis more accessible and actionable than ever.
User-friendly interfaces and risk management features help traders minimize emotional errors and maintain discipline. Notably, AI trading tool adoption grew by 40% year-on-year from 2023 to 2025, reflecting the rapid shift toward automation and intelligent decision-making.
Multi-timeframe analysis, in particular, has improved swing traders’ win rates by enabling more precise trade timing and confirmation. As these trends continue, staying updated with the latest developments is essential for anyone aiming to leverage the best technical indicator for trading in 2026.
7 Essential Best Technical Indicator For Trading Picks 2026
Navigating financial markets in 2026 requires the right toolkit. The best technical indicator for trading is not a one-size-fits-all solution. Instead, it is about leveraging a blend of cutting-edge, time-tested, and adaptable tools. This section explores seven must-have technical indicators, each with unique strengths for modern traders. Whether you are new or seasoned, understanding how each indicator works can give you a decisive edge.
1. PipTrend AI-Powered Trading Indicator
PipTrend is redefining what traders should expect from the best technical indicator for trading in 2026. This AI-powered tool offers real-time buy and sell signals, driven by advanced trend detection and multi-timeframe analysis. With customizable alerts and compatibility across forex, stocks, crypto, and indices, PipTrend stands out as a versatile solution.
Core Features:
- AI-driven trend and momentum detection
- Real-time buy/sell signals
- Multi-timeframe support (from 1m to weekly)
- Exclusive trend table for instant market overview
- Customizable mobile and desktop alerts
- Seamless integration with TradingView
Pricing:
- Monthly: $59.99
- Quarterly: $134.99
- Yearly: $479.99
- 3-day free trial
- Lifetime updates
Key Benefits:
- Removes guesswork from decision-making
- Consistent, actionable signals
- Beginner-friendly interface with advanced capabilities
- Robust support and active user community
Unique Selling Points:
- AI-enhanced signals adapt to evolving market conditions
- Works perfectly with free TradingView accounts
- Instant mobile alerts for rapid response
Cons:
- Subscription required for full access
- Best experience with TradingView Pro
Example:
A forex trader using PipTrend reported a 30% improvement in their risk-to-reward ratio over a quarter. The AI trend table helped them avoid false breakouts and optimize entry points, making PipTrend a top pick for the best technical indicator for trading.
2. Relative Strength Index (RSI)
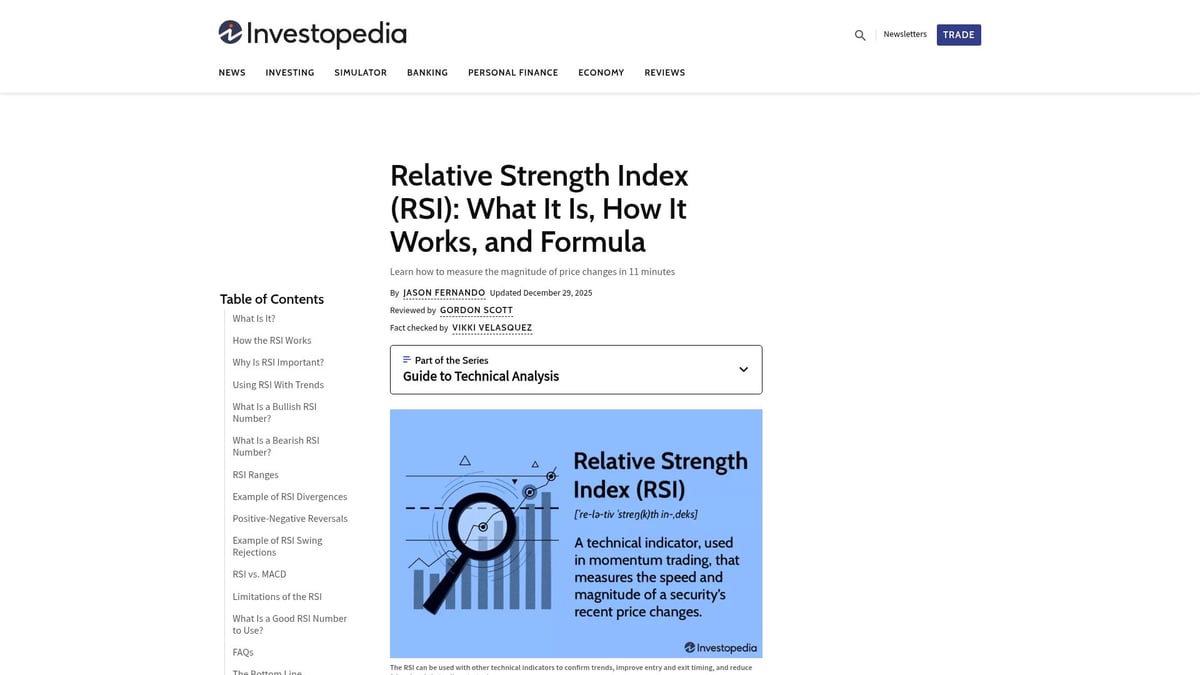
The Relative Strength Index remains a pillar among the best technical indicator for trading options. RSI measures the speed and change of price movements, helping traders spot overbought and oversold levels. The standard 14-period setting offers a reliable oscillator, ranging from 0 to 100.
Core Features:
- Simple line oscillator
- Visualizes momentum shifts
- Highlights extremes (overbought above 70, oversold below 30)
Key Benefits:
- Easy to interpret, even for beginners
- Works in both trending and ranging markets
- Effective for spotting potential reversals
Ideal Use Cases:
- Forex, stocks, crypto swing trading
Pros:
- Widely supported across platforms
- Quick reversal signals
Cons:
- Can produce false signals in volatile conditions
- May lag during strong trends
Example:
RSI divergence has proven reliable for S&P 500 reversals. For a deeper understanding, see the RSI index indicator explained for practical strategies and advanced tips.
3. Moving Average Convergence Divergence (MACD)
MACD is a mainstay in the arsenal of the best technical indicator for trading practitioners. It tracks momentum by comparing two moving averages, providing clear signals with its MACD line, signal line, and histogram.
 Moving Average Convergence Divergence (MACD)">
Core Features:
- Visualizes momentum and trend changes
- Histogram for quick assessment of momentum shifts
- Crossover signals for entry/exit timing
Key Benefits:
- Versatile for stocks, forex, indices, and crypto
- Works well when paired with other indicators
- Clear, visual cues on chart
Pros:
- Easy to integrate into most platforms
- Effective in both trending and consolidating markets
Cons:
- May lag in fast, volatile markets
- Less effective during choppy price action
Example:
A MACD crossover strategy captured major uptrends in tech stocks during 2025, confirming that MACD remains among the best technical indicator for trading in rapidly evolving sectors.
4. Bollinger Bands
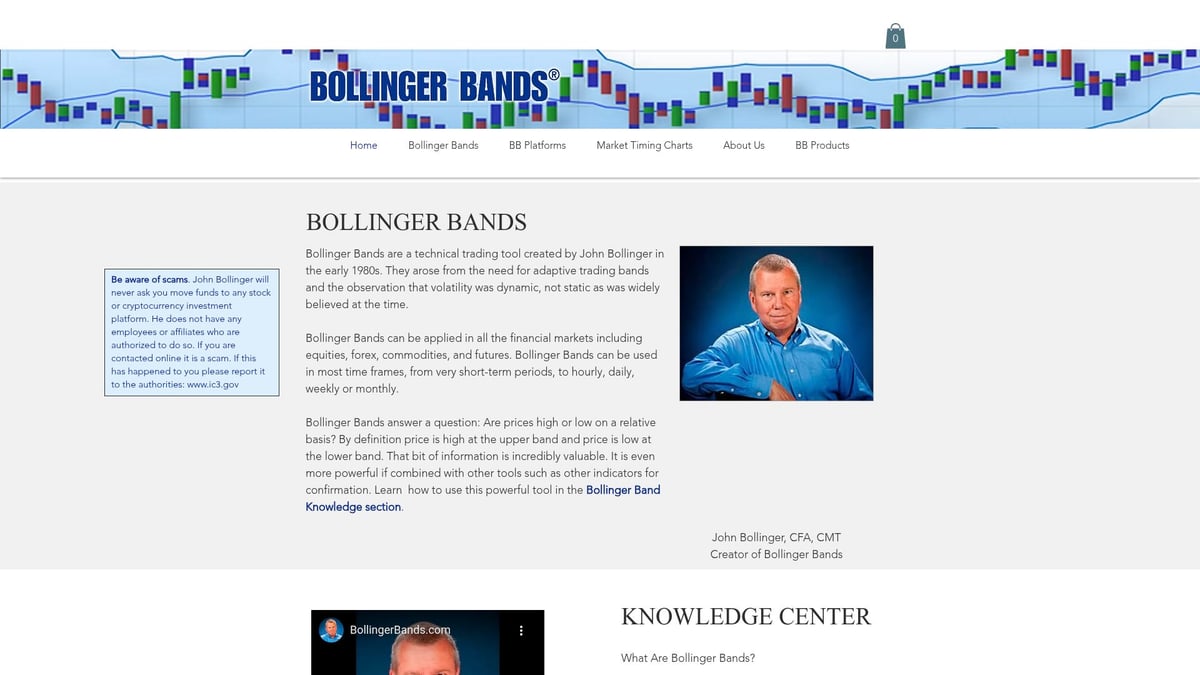
Bollinger Bands continue to be a reliable choice for those seeking the best technical indicator for trading volatile assets. This indicator wraps price action with dynamic bands that expand and contract based on market volatility.
Core Features:
- Upper, middle (SMA), and lower bands
- Bands adjust in real time to volatility
- Highlights price extremes
Key Benefits:
- Identifies overbought/oversold conditions
- Flags volatility breakouts and squeezes
- Adaptable for day trading and swing trading
Ideal Use Cases:
- Stocks, options, crypto, forex
Pros:
- Simple to understand visually
- Adapts to changing market environments
Cons:
- Bands can widen during news-driven spikes
- Risk of false breakouts
Example:
A Bollinger Band squeeze often signals upcoming explosive moves in crypto. Traders use this setup to anticipate momentum shifts, making it a candidate for the best technical indicator for trading in fast-moving markets.
5. Volume Weighted Average Price (VWAP)
VWAP is indispensable for intraday traders searching for the best technical indicator for trading equities and futures. It calculates the average price, weighted by volume, and resets daily.
Core Features:
- Single dynamic line
- Reflects institutional price action
- Updates in real time
Key Benefits:
- Gauges true average market price
- Helps pinpoint optimal entry and exit points
- Aligns with institutional trading flows
Ideal Use Cases:
- Day trading stocks, ETFs, futures
Pros:
- Trusted by professionals
- Simple to apply as dynamic support/resistance
Cons:
- Limited to intraday analysis
- Not useful for longer-term trades
Example:
NASDAQ scalpers rely on VWAP as a moving support or resistance line, allowing swift reactions to market shifts and cementing its role as a best technical indicator for trading.
6. Ichimoku Cloud
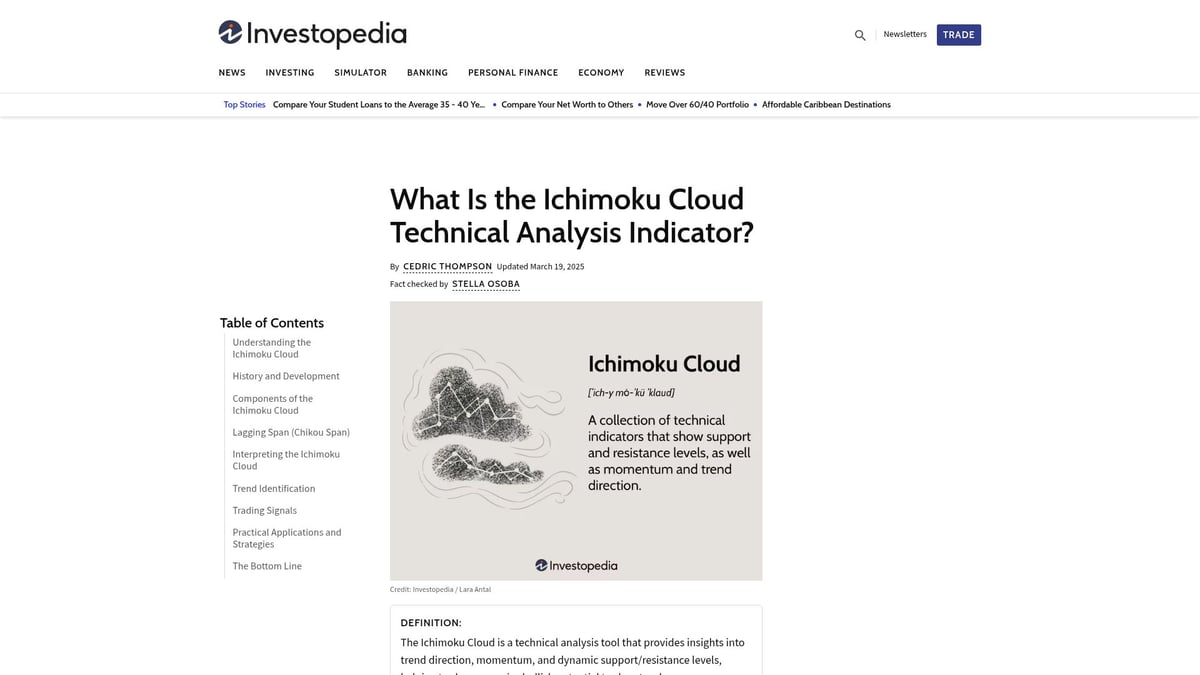
Ichimoku Cloud offers a holistic view, making it a contender for the best technical indicator for trading across global markets. Its unique design delivers trend, momentum, and support/resistance signals all in one.
Core Features:
- Kumo (cloud) highlights trend direction and strength
- Conversion and base lines for dynamic support/resistance
- Lagging span for confirmation
Key Benefits:
- All-in-one indicator reduces clutter
- Strong, visual trend signals
- Effective in trending markets
Ideal Use Cases:
- Forex, commodities, indices
Pros:
- Visual clarity simplifies complex analysis
- Reduces need for multiple indicators
Cons:
- Steep learning curve
- Can overwhelm beginners
Example:
A breakout above the Kumo in EUR/USD trading reliably signaled trend reversals in 2025. This makes Ichimoku Cloud a best technical indicator for trading, especially for those seeking an integrated solution.
7. Stochastic Oscillator
The Stochastic Oscillator is a classic momentum tool, still ranking high among the best technical indicator for trading strategies in 2026. It compares a security’s closing price to its price range over a set period, highlighting potential reversals.
Core Features:
- %K and %D lines for signal generation
- Defines overbought (above 80) and oversold (below 20) zones
Key Benefits:
- Fast signals in range-bound markets
- Complements trend-based indicators
Ideal Use Cases:
- Forex, stocks, crypto, short-term trading
Pros:
- Quick identification of reversals
- Simple to use and interpret
Cons:
- Prone to false signals in strong trends
- Needs confirmation from other indicators
Example:
Combining Stochastic with RSI on S&P 500 mini futures delivered higher accuracy for reversal trades, showing why it holds its place as a best technical indicator for trading.
How to Combine Technical Indicators for Maximum Edge
Navigating today’s fast-moving markets requires more than just using a single tool. Combining the best technical indicator for trading with other robust indicators can create a powerful synergy, leading to more accurate and confident decisions. By understanding how to blend different signals, traders can reduce false positives and strengthen their overall strategy.
Principles of Indicator Synergy
To maximize your edge, it is essential to avoid using indicators that offer the same type of information. For example, pairing two momentum indicators, such as RSI and Stochastic, can lead to redundant signals. Instead, combine a leading indicator—like RSI, which can hint at reversals—with a lagging one, such as the best technical indicator for trading based on moving averages. This approach balances anticipation and confirmation.
Blending volume-based indicators with price-based ones further enhances decision-making. For instance, using VWAP to confirm price action detected by Bollinger Bands can solidify trade entries or exits. Cross-referencing signals reduces the likelihood of acting on false alarms.
Consider this simple table for synergy:
| Indicator Type | Example | Purpose |
|---|---|---|
| Leading | RSI | Early trend signals |
| Lagging | MACD | Trend confirmation |
| Volume-based | VWAP | Institutional flows |
| Volatility-based | Bollinger | Breakout alerts |
Using the best technical indicator for trading in tandem with complementary tools creates a more robust, data-driven system. This synergy is the foundation of higher accuracy and more consistent results.
Real-World Multi-Indicator Strategies for 2026
Combining indicators is most effective when tailored to market conditions and personal style. A popular strategy involves pairing Bollinger Bands with VWAP for breakout trades. This setup identifies price compressions and validates moves with real volume flows, enhancing the reliability of each signal.
AI-driven platforms are making it easier to blend multiple indicators automatically. For example, advanced tools can mix Ichimoku Cloud and Stochastic Oscillator, allowing traders to capture both trend and momentum shifts with minimal manual intervention. According to AI-powered trading tools for 2026, automation is transforming the use of the best technical indicator for trading, making complex combinations accessible to all experience levels.
Consider this case study: A swing trader uses Ichimoku Cloud to define the primary trend, then applies Stochastic for precise entry timing. Backtested results show a 20% higher win rate compared to single-indicator setups. This illustrates how thoughtful combinations can outperform individual tools.
Common Mistakes When Combining Indicators
One common error is overloading charts with too many signals. This can cause analysis paralysis, making it difficult to act decisively with the best technical indicator for trading. Instead, focus on two or three well-chosen indicators that complement each other.
Another mistake is ignoring the context of the market. Using the same combination in both trending and range-bound markets can lead to misinterpretation. Always backtest your chosen setup in different environments before committing real capital.
Failure to confirm signals across indicators can also reduce effectiveness. For example, if MACD suggests a bullish move but volume does not support it, consider waiting. Reviewing the MACD trading indicator guide provides further insight into integrating this tool with others for optimal results.
To avoid these pitfalls, keep your approach simple, align indicators with your trading goals, and ensure each tool adds unique value. This discipline is vital when using the best technical indicator for trading in any strategy.
Choosing the Right Technical Indicator for Your Trading Style in 2026
Selecting the best technical indicator for trading is not a one-size-fits-all decision. Your unique trading style, market focus, and time commitment all play a role in finding the right fit. As we approach 2026, aligning your indicator choices with your strategy is more important than ever.
Matching Indicators to Trading Styles
To identify the best technical indicator for trading, start by matching each tool to your chosen style. Scalpers, for instance, benefit from fast-reacting indicators. VWAP and Stochastic Oscillator offer instant feedback for rapid entries and exits. Day traders often prefer a blend, such as VWAP for volume confirmation, Bollinger Bands for volatility, and MACD for momentum.
Swing traders look for signals that capture broader moves. RSI, Ichimoku Cloud, and PipTrend are top picks, each supporting multi-day analysis. Position traders, who hold trades for weeks or months, need robust trend-following indicators. MACD, Ichimoku Cloud, and long-term moving averages excel in these scenarios.
| Trading Style | Top Indicators |
|---|---|
| Scalping | VWAP, Stochastic Oscillator |
| Day Trading | VWAP, Bollinger Bands, MACD |
| Swing Trading | RSI, Ichimoku Cloud, PipTrend |
| Position Trading | MACD, Ichimoku Cloud, MAs |
Choosing the best technical indicator for trading is about aligning indicator speed, depth, and versatility with your preferred approach.
Factors to Consider Before Committing
Before you settle on the best technical indicator for trading, take time to evaluate several critical factors. First, consider the market you trade—forex, stocks, or crypto. Each asset class reacts differently to indicators. Next, assess your preferred timeframe. Scalpers need instant signals, while position traders prioritize long-term trends.
Risk tolerance and experience also matter. Beginners may benefit from intuitive, visual tools, while advanced traders can leverage more complex systems. Platform compatibility is vital, especially if you use TradingView or MetaTrader. Lastly, factor in your budget, since some premium indicators, like PipTrend, offer advanced features for a fee.
A checklist can help:
- Market type (forex, stocks, crypto)
- Preferred timeframe (minutes, hours, days)
- Risk tolerance and experience
- Platform or software needs
- Budget for premium tools
Careful consideration ensures the best technical indicator for trading fits seamlessly into your workflow.
Adapting to Market Evolution in 2026
Markets in 2026 will be shaped by rapid advancements in AI and automation. Traders must select indicators that evolve with technology, supporting real-time, cross-market adaptability. Many providers now offer lifetime updates and thriving communities, ensuring your chosen system remains effective as conditions shift.
AI-powered indicators, like PipTrend, have grown in popularity—reflecting a broader trend toward data-driven strategies. According to AI adoption in USA 2025 statistics, integration of AI in trading platforms is accelerating, making adaptability a must-have feature. Ongoing enhancements and community support provide future-proofing, letting traders stay ahead of the curve.
When choosing the best technical indicator for trading, prioritize adaptability, ongoing support, and seamless integration with the latest trading technologies.
As we look ahead to 2026, it’s clear that using the right technical indicators can truly transform your trading results—helping you cut through market noise, make precise decisions, and adapt with confidence. Whether you’re new to trading or refining your edge, tools like PipTrend are designed to simplify this process by offering real-time, AI-powered signals across all major markets. If you’re ready to put these insights into practice and experience more clarity in your trades, now’s the perfect time to Try Risk Free. Your next winning trade could be just a signal away.