
Day trading in 2026 is more dynamic than ever, with traders relying on advanced tools to stay ahead of the curve. The best technical indicator for day trading can make the difference between success and missed opportunities in fast-moving markets.
Technical indicators have become essential for analyzing trends, spotting momentum shifts, and confirming trade signals. In this guide, you will discover seven of the most impactful technical indicators shaping trading strategies this year.
Curious about which tools can sharpen your trading edge? Read on for actionable insights to help you thrive in today’s competitive trading environment.
The Role of Technical Indicators in Modern Day Trading
Technical indicators have transformed the way day traders approach financial markets, evolving rapidly with the rise of advanced analytics and artificial intelligence by 2026. In an environment where milliseconds can determine outcomes, the best technical indicator for day trading is no longer just a tool, but a strategic edge.
Today’s indicators analyze price action, trends, and momentum with remarkable speed and accuracy. By processing massive datasets and recognizing complex patterns, these tools enable traders to make informed decisions in volatile markets. For modern traders, using a single indicator is rarely enough—over 80% of day traders now combine at least two technical indicators to confirm signals and reduce the risk of false entries (Investopedia, 2024).
Algorithmic and high-frequency trading have reshaped the effectiveness of indicators. With machines executing thousands of trades per second, traditional setups can become obsolete unless adapted. Traders must regularly evaluate which combination serves as the best technical indicator for day trading under current market conditions.
Key Advantages of Using Technical Indicators:
- Analyze historical and real-time data for actionable insights
- Confirm trends and momentum shifts before entering trades
- Reduce emotional bias with objective signals
- Adapt strategies to changing volatility and liquidity
For example, a trader might use a momentum oscillator to spot potential reversals, then confirm with a trend-following tool before acting. This layered approach enhances accuracy and confidence. Many successful traders customize indicator settings to match their asset class or timeframe, balancing complexity and simplicity for optimal results.
| Indicator Type | Main Function | Common Use Case |
|---|---|---|
| Trend-Following | Identify direction | Spotting sustained moves |
| Momentum | Gauge speed/strength | Detecting reversals |
| Volatility | Measure price fluctuations | Sizing positions, stop-loss |
| Volume-Based | Track trading activity | Confirming breakout validity |
Customization and adaptability are now essential. No single setup remains effective forever, making it vital to review and adjust which tools qualify as the best technical indicator for day trading. The influx of AI-powered solutions, like those featured in curated lists such as Best indicators for day trading, has made it easier for both beginners and professionals to refine their strategies.
In summary, the modern landscape demands a thoughtful blend of indicators, with a focus on confirmation and flexibility. Striking the right balance between simplicity and depth ensures traders can adapt quickly, maximizing their edge with the best technical indicator for day trading as markets continue to evolve.
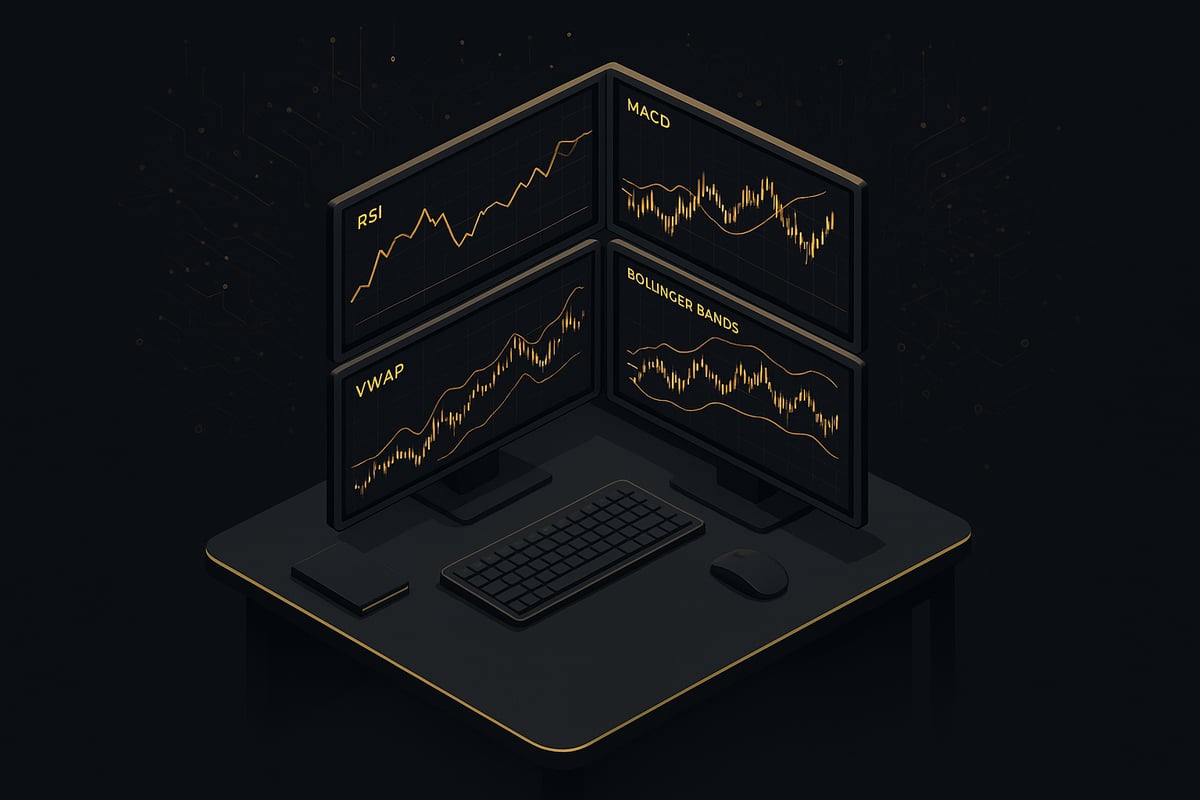
7 Essential Best Technical Indicator for Day Trading in 2026
Day trading in 2026 demands precision, speed, and adaptability. With volatility at all-time highs and technology reshaping the landscape, the best technical indicator for day trading can make the difference between a winning and losing trade.
This section reviews seven standout technical indicators, each selected for its relevance, reliability, adaptability, and proven effectiveness. Whether you are a seasoned professional or just starting, choosing the right combination of these tools is crucial for your trading success.
1. PipTrend AI Trading Indicator
The PipTrend AI Trading Indicator is redefining what traders expect from the best technical indicator for day trading. This AI-powered solution integrates seamlessly with TradingView and delivers real-time buy and sell signals across all asset classes.
What sets PipTrend apart is its advanced multi-timeframe analysis, automatic trend detection, and customizable alerts. Liquidity level identification helps traders pinpoint optimal entry and exit points, minimizing guesswork. The interface is clean, which reduces chart clutter and lets traders focus on actionable signals.
Pricing Structure:
- $59.99 per month
- $134.99 quarterly
- $479.99 annually
- 3-day free trial and a 30-day refund policy
Key Benefits:
- Removes subjectivity from decision-making
- Boosts trading confidence with AI-driven signals
- Works for retail, day, swing, beginner, and advanced traders
Pros:
- Fast alerts and lifetime updates
- Strong, supportive community
- Beginner-friendly design
Cons:
- Requires a TradingView account
- Subscription-based model
Users report higher win rates and more consistent profit growth, especially in forex and crypto scalping. PipTrend's clarity and real-time adaptability make it a top contender for anyone seeking the best technical indicator for day trading in today's fast-paced markets.
2. [Relative Strength Index (RSI)]
The Relative Strength Index (RSI) is a staple among day traders seeking the best technical indicator for day trading. RSI measures the speed and magnitude of price changes, making it ideal for identifying overbought and oversold conditions.
RSI operates on a scale from 0 to 100, typically using a 14-period default. When values approach the extremes (above 70 or below 30), traders watch for potential reversals or confirmation of momentum.
Core Features:
- Simple oscillator with clear reversal signals
- Default 14-period setting, but fully customizable
- Effective across asset classes
Benefits:
- Helps avoid poor entries by signaling exhaustion
- Confirms trend strength and momentum shifts
- Easy-to-read visual cues
Ideal Use Cases:
- Spotting short-term reversals in volatile stocks
- Confirming momentum before entering trades
Pros:
- Straightforward interpretation
- Supported by nearly all trading platforms
Cons:
- Can generate false signals in strong trends
- Works best when combined with other indicators
For more in-depth insight, see this RSI indicator explained guide for day traders. RSI remains one of the most-used indicators for intraday strategies, and its adaptability cements its place as a best technical indicator for day trading in 2026.
3. [Volume Weighted Average Price (VWAP)]
Volume Weighted Average Price (VWAP) is a dynamic indicator widely adopted as the best technical indicator for day trading by professionals and institutions alike. VWAP calculates the average price of an asset, weighted by volume, throughout the trading day.
This indicator updates in real time, providing a moving benchmark that reflects where most trading activity occurs. VWAP helps traders identify fair value, guiding both entries and exits by showing if the market is trading above or below this average.
Core Features:
- Real-time calculation, resets daily
- Acts as support or resistance intraday
- Institutional trading benchmark
Benefits:
- Identifies institutional buying and selling zones
- Guides risk management and trade execution
- Adapts to market flow, reducing emotional trading
Ideal Use Cases:
- Day trading equities and futures
- Scalping and short-term trading strategies
Pros:
- Objective and data-driven
- Easy to incorporate into existing strategies
Cons:
- Not suitable for long-term analysis
- Requires reset each trading session
Hedge funds use VWAP to minimize slippage during large trades. Its ability to reveal hidden market dynamics makes it a consistent choice for anyone searching for the best technical indicator for day trading.
4. [Moving Average Convergence Divergence (MACD)]
The Moving Average Convergence Divergence (MACD) indicator is a powerful trend-following momentum tool, and a mainstay for those seeking the best technical indicator for day trading. MACD reveals the relationship between two moving averages, highlighting momentum shifts and potential reversals.
MACD consists of three components: the MACD line, the signal line, and the histogram. The interplay between these elements provides clear visual cues for traders.
Core Features:
- Customizable fast and slow moving averages
- Histogram for visualizing momentum changes
- Signal line crossovers for entry and exit points
Benefits:
- Spots trend changes and confirms trade direction
- Divergence signals early warnings of reversals
- Works across forex, stocks, and crypto
Ideal Use Cases:
- Intraday trend confirmation
- Capturing momentum shifts in fast-moving markets
Pros:
- Highly versatile and adaptable
- Effective in a range of market conditions
Cons:
- Lagging indicator, may provide late signals
- Needs confirmation from other tools
A popular MACD crossover strategy is used to capture intraday rallies. MACD's reliability and visual clarity ensure its place as a best technical indicator for day trading in 2026.
5. [Bollinger Bands]
Bollinger Bands offer a unique way to visualize volatility and identify trading opportunities, making them indispensable for anyone searching for the best technical indicator for day trading. These bands consist of an upper and lower boundary plotted around a moving average, adjusting dynamically to market conditions.
When the bands squeeze together, it signals low volatility and a potential breakout. Conversely, wide bands indicate heightened volatility, often following significant price moves.
Core Features:
- Dynamic bands based on standard deviation
- Squeeze and breakout signals
- Adaptable to multiple timeframes
Benefits:
- Identifies breakout and reversal opportunities
- Visualizes periods of high and low volatility
- Simple to combine with other indicators
Ideal Use Cases:
- Scalping volatile assets like cryptocurrencies
- Anticipating explosive moves after consolidation
Pros:
- Effective for volatility analysis
- Widely supported and easy to interpret
Cons:
- May produce false breakouts in sideways markets
- Requires context and confirmation
Traders often use Bollinger Band squeezes to predict rapid price expansion. This adaptability and visual clarity ensure Bollinger Bands remain a best technical indicator for day trading.
6. [Stochastic Oscillator]
The Stochastic Oscillator is a momentum indicator prized for its sensitivity and early reversal signals, securing its place as a best technical indicator for day trading. It compares a security's closing price to its price range over a set period, generating actionable crossover signals.
The oscillator consists of two lines, %K and %D, which move between 0 and 100. Crosses in overbought (above 80) or oversold (below 20) zones often signal imminent reversals.
Core Features:
- Dual-line oscillator for momentum tracking
- Overbought/oversold zones
- Crossover signals for entry and exit
Benefits:
- Early warnings of market exhaustion
- Enhances entry and exit timing
- Complements trend-following indicators
Ideal Use Cases:
- Short-term reversals in forex and equities
- Scalping in range-bound markets
Pros:
- Highly responsive to price changes
- Easy to integrate with other tools
Cons:
- Prone to false signals in strong trends
- Best used with filters and confirmation
Traders use stochastic crossovers for quick entries during range-bound trading. Its precision and adaptability make it a best technical indicator for day trading.
7. [Average True Range (ATR)]
Average True Range (ATR) is the go-to volatility gauge for disciplined risk management, widely regarded as a best technical indicator for day trading. ATR calculates the average range between high and low prices over a specified period, adapting in real time to changing market conditions.
ATR does not indicate direction but excels at helping traders set stop-losses and position sizes based on current volatility. This objectivity makes it invaluable for both breakout and trend strategies.
Core Features:
- Real-time volatility measurement
- Adaptive stop-loss and target placement
- Trend strength insight
Benefits:
- Enhances risk management discipline
- Adapts to all asset classes and market regimes
- Helps traders avoid emotional decisions during high volatility
Ideal Use Cases:
- Sizing positions in forex, stocks, and crypto
- Managing trailing stops for maximizing profit
Pros:
- Objective and easy-to-use
- Works well with trend indicators
Cons:
- Does not provide directional signals
- Should be combined with other indicators
ATR-based trailing stops help traders lock in profits during strong trends. Its versatility and focus on risk control ensure ATR's continued status as a best technical indicator for day trading.
How to Combine Technical Indicators for Optimal Day Trading Strategies
Combining technical indicators is a crucial step for any trader seeking the best technical indicator for day trading success. Instead of relying on a single tool, blending indicators can yield a clearer view of price action, trend strength, and market volatility. This multi-faceted approach helps filter out noise and reveals more reliable trading signals.
Choosing Complementary Indicators
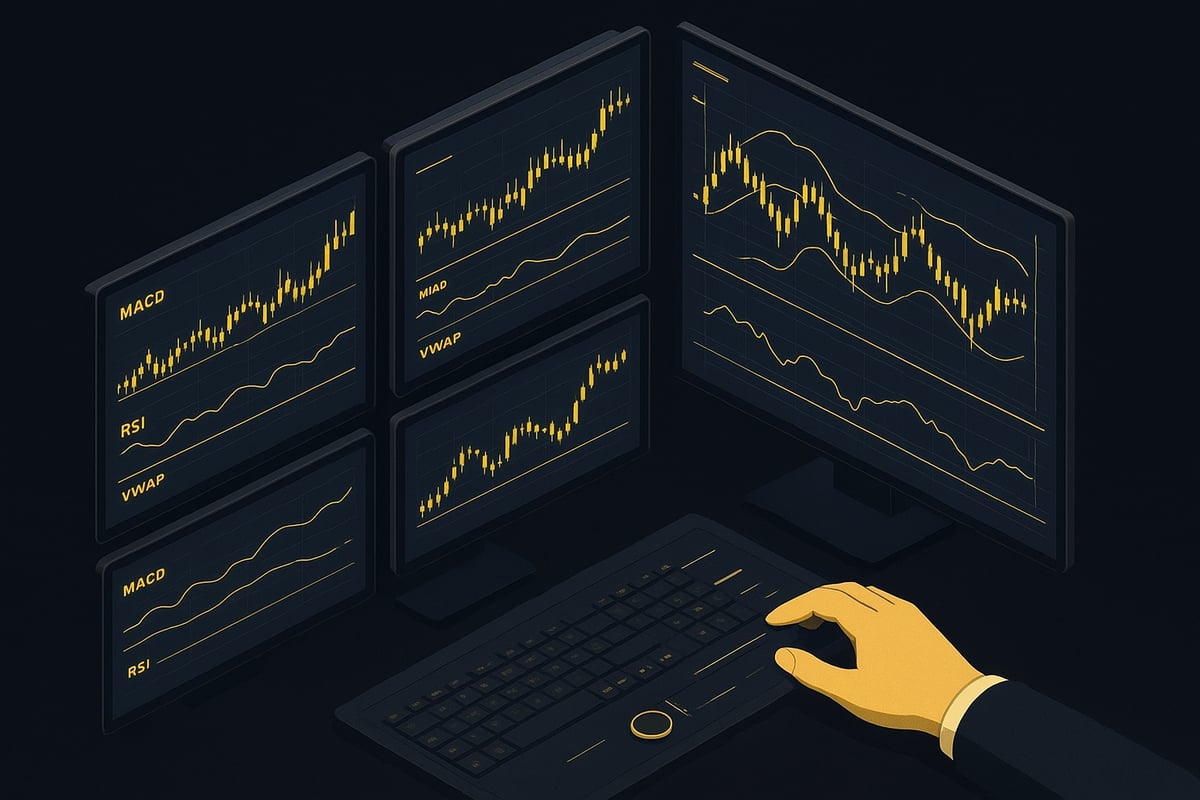
Selecting the right mix starts with understanding the strengths and weaknesses of each tool. The best technical indicator for day trading should complement others rather than duplicate signals. For example, pairing a momentum oscillator with a trend-following tool provides a more balanced view, reducing the risk of acting on false signals. Avoid using multiple indicators that analyze the same aspect of price movement, which can lead to analysis paralysis. Instead, focus on two or three indicators that each add unique value to your strategy.
Common Indicator Combinations
Some combinations have stood the test of time in the day trading world. For instance, using the Relative Strength Index (RSI) with the MACD indicator guide allows traders to confirm momentum shifts and trend changes simultaneously. Another proven blend is the use of VWAP with Bollinger Bands, which helps pinpoint high-probability entry and exit points by combining price location with volatility. These pairings make it easier to identify clear signals while filtering out market noise. Traders who consistently combine complementary indicators report a 15% higher win rate, showing the tangible benefits of this approach.
Case Study: A Winning Day Trading Setup
Consider a setup where a trader uses VWAP trading indicator for real-time price benchmarks, the RSI for momentum confirmation, and the ATR for setting adaptive stop-losses. This trio covers price fairness, momentum, and risk management, forming a robust system for intraday trades. By customizing indicator settings for specific assets and timeframes, traders can further refine results. Before going live, it's wise to backtest these combinations to ensure they fit current market conditions. As the market evolves, so should your mix of the best technical indicator for day trading to maintain an edge.
Key Trends Shaping Technical Indicator Development in 2026
The landscape of the best technical indicator for day trading is rapidly evolving, driven by technological innovation and shifting trader demands. As we look toward 2026, several key trends are emerging that will shape how traders select and use these powerful tools.
AI and Machine Learning Integration
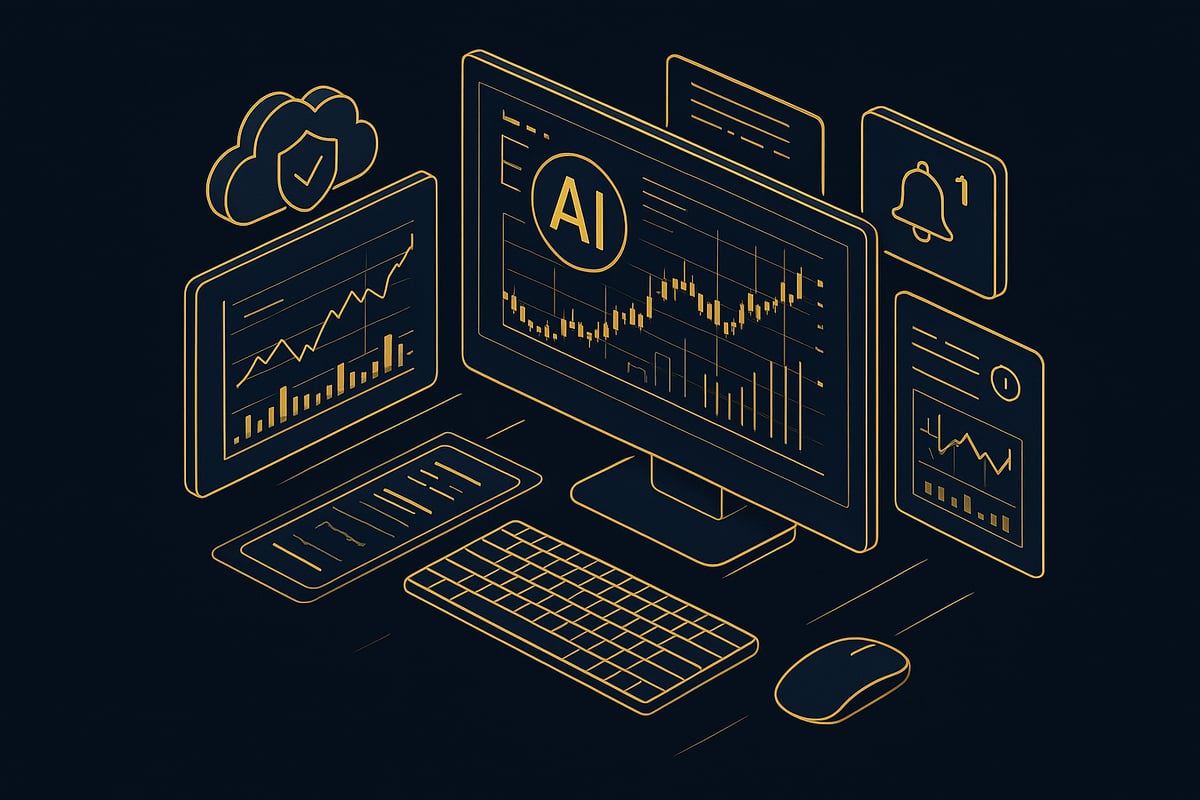
Artificial intelligence and machine learning are now at the core of the best technical indicator for day trading. These technologies enable real-time analysis, adaptive learning, and predictive modeling. Advanced indicators can process vast amounts of market data, adjusting strategies based on evolving patterns. For example, assessing the impact of technical indicators on machine learning models for stock price prediction shows that AI-enhanced indicators are improving the accuracy of high-frequency trading systems, giving traders a significant edge.
Automation and Platform Integration
Seamless automation is another defining trend. By 2026, the best technical indicator for day trading will be deeply integrated with platforms like TradingView and MetaTrader. Automated alerts, instant execution, and algorithmic strategies are now standard features. This integration allows traders to react instantly to market changes without manual intervention. The result is a smoother workflow and reduced risk of human error, making day trading more accessible and efficient for all experience levels.
Mobile-First Features, Customization, and Security
Modern traders demand flexibility and control. Mobile-first design means the best technical indicator for day trading now provides real-time notifications and analysis on smartphones and tablets, enabling traders to monitor markets on the go. User interfaces have become more customizable, with adjustable settings, themes, and layouts that cater to individual preferences. At the same time, cloud-based solutions bring concerns about data privacy and security, prompting providers to implement robust encryption and user authentication protocols.
Multi-Asset, Multi-Timeframe Compatibility and Future Impact
The best technical indicator for day trading in 2026 supports a wide range of asset classes and timeframes. This versatility allows traders to switch between forex, stocks, crypto, and commodities with ease. Tools like PipTrend are leading the way, offering AI-powered analysis that adapts to different market environments. As these trends converge, traders will benefit from smarter, faster, and more secure indicators, fundamentally changing how strategies are developed and executed.
| Trend | Impact on Day Traders |
|---|---|
| AI & Machine Learning | Improved prediction, adaptive strategies |
| Automation & Integration | Instant alerts, reduced manual errors |
| Mobile & Customization | On-the-go trading, tailored interfaces |
| Security Advances | Enhanced data protection |
Looking ahead, these trends will continue to shape the selection and effectiveness of the best technical indicator for day trading. By embracing AI, automation, and user-centric features, traders can stay ahead of the curve and make more informed, profitable decisions in increasingly complex markets.
As you’ve seen, having the right technical indicators can truly sharpen your edge in the fast-paced world of day trading—especially when markets are evolving as quickly as they are in 2026. If you’re ready to put these insights into practice and want real-time, AI-powered signals that cut through the noise, it’s time to experience the difference for yourself. You don’t have to trade alone or second-guess your strategy. Let’s take your trading to the next level together—Try Risk Free.