
Intraday trading in 2026 is faster and more competitive than ever, offering both immense opportunity and real risk for traders who want to stay ahead. With the explosive rise in day trading, the sheer number of indicators for intraday strategies can feel overwhelming even for seasoned professionals. Choosing the right tools is now the difference between consistent profit and costly mistakes. In this guide, you will discover actionable insights and proven techniques to help both beginners and experienced traders optimize their approach. Get ready to unlock the top 7 powerful indicators for intraday trading in 2026 and elevate your trading strategy for maximum results.
Understanding Intraday Trading Indicators
Intraday trading thrives on speed, precision, and the ability to interpret market signals in real time. To stay ahead, traders rely on specialized tools that help them navigate rapid price swings and capture fleeting opportunities. Understanding how indicators for intraday work is the foundation for any effective day trading strategy.
What Are Intraday Trading Indicators?
Intraday trading indicators are analytical tools designed to provide real-time insights into price action, volume, and volatility within a single trading session. Unlike long-term indicators that smooth out data over days or weeks, indicators for intraday focus on capturing rapid market shifts and short-term trends.
Examples include moving averages, momentum oscillators, and volume-based metrics. These tools help traders identify trend direction, measure momentum, and pinpoint optimal entry and exit points. By translating raw price data into actionable signals, indicators for intraday trading are essential for navigating the fast, volatile landscape of modern markets.
Importance of Indicators in Intraday Trading
The right indicators for intraday can transform how traders respond to market volatility. In fast-moving environments, these tools enhance decision-making speed by providing objective, data-driven trade signals. Traders can use indicators to set clear stop-loss and profit targets, reducing emotional bias and improving risk management.
Indicators also support algorithmic and automated strategies, allowing for consistent execution. For example, a trader using a momentum indicator to confirm trend strength may avoid entering trades during weak market conditions. Real-world case studies show that integrating indicators for intraday trading often leads to better timing and increased profitability.
Types of Intraday Trading Indicators
There are several categories of indicators for intraday, each serving a unique purpose:
| Type | Description | Example Indicators |
|---|---|---|
| Trend-following | Identify market direction | Moving Averages, MACD |
| Momentum | Measure speed of price moves | RSI, Stochastic Oscillator |
| Volatility | Assess price fluctuations | Bollinger Bands |
| Volume-based | Analyze trading activity | Volume, A/D Line |
Indicators can be classified as leading (predicting potential moves) or lagging (confirming trends). Most successful traders combine 2-3 types for confirmation, increasing accuracy and reducing false signals.
Customizing indicators for intraday is crucial. Adjusting parameters to fit specific assets—stocks, forex, crypto, or indices—and timeframes (such as 1-minute or 15-minute charts) helps capture relevant patterns. For a deeper dive into the most effective tools, explore the Best Indicators for Intraday Trading for expert insights and strategy tips.
Blending different indicators for intraday across asset classes gives traders a multidimensional view, leading to more confident and timely decisions.
How to Choose the Right Intraday Indicators in 2026
Selecting the right indicators for intraday strategies is critical for navigating the complexities of the 2026 trading landscape. With advanced tools and overwhelming options, traders must focus on a methodical approach to indicator selection for consistent results.
Key Factors to Consider
When choosing indicators for intraday, begin by assessing the volatility and liquidity of your target market. Asset class matters; stocks, forex, crypto, and indices each respond differently to technical signals. Match your indicator to the timeframe you trade, whether it is 1-minute scalping or 15-minute swing trades.
Responsiveness is crucial. Fast-moving markets require indicators that react quickly, while slower assets may benefit from more smoothing. Ease of interpretation matters too; complex signals can slow down your decisions in high-stress scenarios.
Back your choices with data wherever possible. For example, the Intraday Market Predictability Study demonstrates how robust indicators for intraday can enhance real-time trading accuracy. Ultimately, select tools that fit your style and help you act decisively.
Combining Indicators for Maximum Accuracy
Relying on a single tool can lead to missed opportunities or false signals. Instead, combine complementary indicators for intraday to boost accuracy and confidence. Pair a trend-following indicator, such as an Exponential Moving Average, with a momentum oscillator like RSI to validate your entries and exits.
Limit your setup to two or three core indicators for intraday to avoid analysis paralysis. For example, using MACD with RSI helps filter out noise and confirms market direction. Watch for conflicting signals; if one indicator suggests a buy while another warns of overbought conditions, reconsider your trade.
Studies show traders who blend multiple indicators for intraday improve their win rates significantly. The key is synergy, not quantity. Test combinations, and stick to what consistently delivers clear, actionable signals.
Common Mistakes to Avoid
Many traders fall into traps that undermine their intraday performance. Here are key mistakes to watch for:
| Mistake | Impact |
|---|---|
| Over-reliance on one indicator | Missed signals, poor adaptability |
| Ignoring volume or volatility cues | Increased risk, late entries or exits |
| Chasing lagging signals in fast markets | Missed moves, higher losses |
| Skipping backtesting and adaptation | Reduced effectiveness in changing markets |
Overlooking these pitfalls can be costly. For example, some traders ignored volatility bands during 2025’s sudden market spikes and suffered steep losses. It is essential to review and adapt your indicators for intraday as market conditions evolve.
Continuous learning is vital. Use demo accounts to test new setups and stay updated with technological advancements. This disciplined approach ensures your indicators for intraday remain effective and your strategy stays ahead of the curve.
Top 7 Powerful Indicators for Intraday Trading in 2026
Navigating the fast-paced world of intraday trading in 2026 demands precision, speed, and adaptability. With markets more dynamic than ever, traders must rely on the most effective indicators for intraday to capture fleeting opportunities and manage risk. The right tools can help you identify trends, time your entries and exits, and avoid costly mistakes.
Below, we break down the top 7 powerful indicators for intraday trading, each offering unique insights and strategic advantages. Whether you trade stocks, forex, crypto, or indices, leveraging these indicators for intraday can sharpen your edge and elevate your results.
1. Relative Strength Index (RSI)
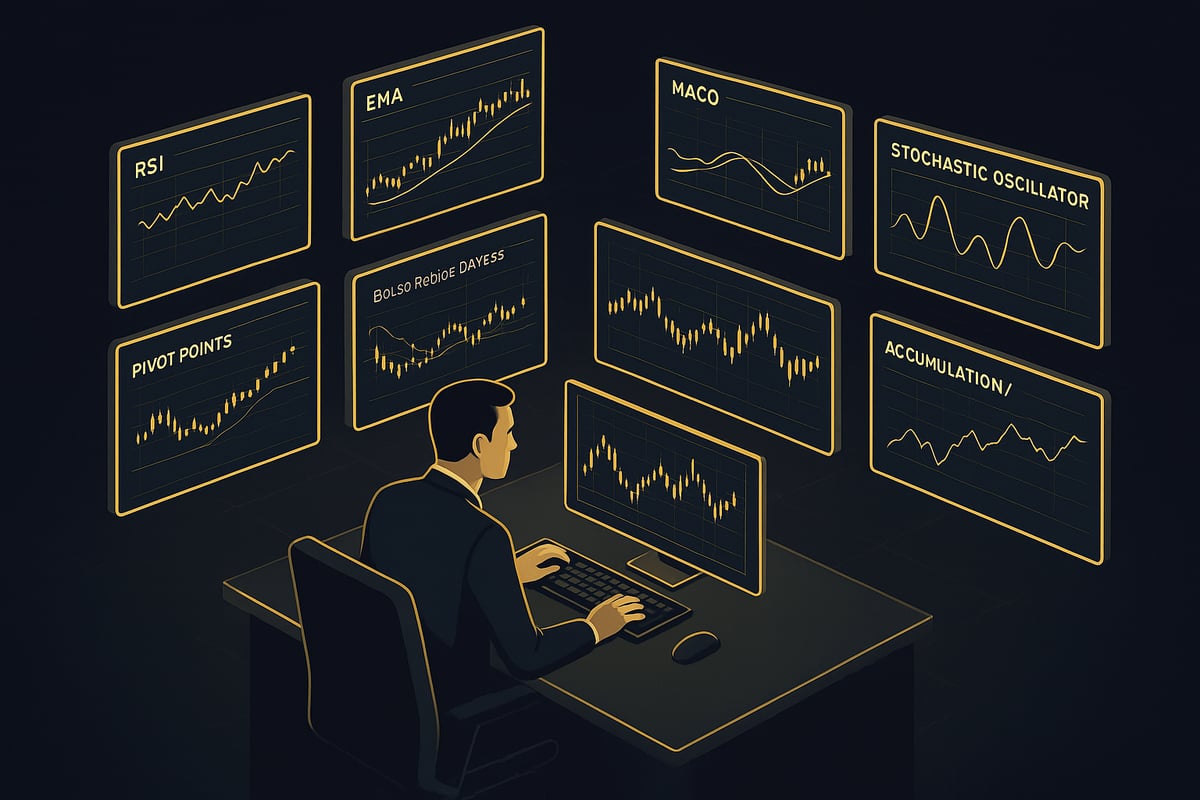
The Relative Strength Index (RSI) is a cornerstone among indicators for intraday, measuring the speed and magnitude of price movements. RSI oscillates between 0 and 100, with levels below 30 signaling oversold and above 70 indicating overbought conditions. This allows traders to spot potential reversal points and confirm the strength of ongoing trends.
In intraday trading, RSI is prized for its responsiveness and clarity. For example, during 2025’s tech stock rallies, RSI crossovers often anticipated sharp reversals, providing traders with timely signals. The indicator adapts seamlessly across asset classes, from forex to crypto, making it a versatile choice for diverse portfolios.
A common setup uses a 14-period RSI on 5-minute or 15-minute charts, but many traders customize settings for faster signals. Pairing RSI with other indicators for intraday, such as moving averages, enhances accuracy and reduces false positives.
One key tip is to watch for RSI divergence, where price moves in the opposite direction of RSI, as this often precedes major price shifts. However, RSI can produce misleading signals during sideways or choppy markets, so always confirm with other indicators for intraday.
Want to master RSI for your own strategy? Check out this comprehensive Relative Strength Index (RSI) Guide for deeper insights and advanced setups.
2. Exponential Moving Average (EMA)
The Exponential Moving Average (EMA) stands out among indicators for intraday trading due to its ability to react swiftly to price changes. Unlike a simple moving average, EMA gives more weight to recent prices, making it highly effective for capturing short-term trends and dynamic support or resistance levels.
Popular EMA configurations for intraday traders include the 9-EMA, 21-EMA, and 50-EMA. On a 5-minute chart, for example, a crossover of the 9-EMA above the 21-EMA might signal a bullish move, while the reverse suggests bearish momentum. In 2025, high-frequency traders frequently used EMA crossovers as entry and exit triggers, especially in volatile sessions.
A practical approach is to combine EMA with price action, using candlestick patterns to confirm signals. This blend helps filter out noise and provides more reliable trade setups. When using EMA as one of your indicators for intraday, remember that it can generate whipsaws in low-volume periods, so it is crucial to monitor market liquidity.
For best results, adjust your EMA settings to match your chosen timeframe and asset volatility. Always pair EMA with a momentum or volume indicator for a comprehensive view, as relying solely on EMA may lead to missed opportunities or premature trades.
3. Moving Average Convergence Divergence (MACD)
Moving Average Convergence Divergence (MACD) is a dual-purpose tool that combines trend and momentum analysis, making it a staple among indicators for intraday. MACD uses two EMAs (typically 12 and 26 periods) and a signal line (9-period EMA) to generate actionable buy and sell signals.
The MACD histogram visualizes the difference between the MACD line and the signal line, revealing momentum shifts and potential reversals. Traders look for crossovers—when the MACD line crosses above the signal line, it suggests bullish momentum, while crossing below indicates bearish sentiment. During 2025’s market corrections, MACD divergence (where price and MACD move in opposite directions) helped traders exit positions before major downturns.
MACD is effective across stocks, forex, and indices, and works well on multiple timeframes. For intraday trading, many use the 5-minute or 15-minute chart to capture rapid price movements. However, MACD can lag in extremely volatile or news-driven markets, so combining it with faster indicators for intraday is advisable.
A table summarizing MACD signals:
| Signal Type | Interpretation | Action |
|---|---|---|
| Bullish Crossover | MACD crosses above signal | Consider buying |
| Bearish Crossover | MACD crosses below signal | Consider selling |
| Divergence | Price vs. MACD mismatch | Watch for reversal |
For optimal results, always validate MACD signals with trend or volume indicators for intraday.
4. Bollinger Bands
Bollinger Bands are a volatility-based indicator that consists of a moving average flanked by two standard deviation bands. These bands expand during periods of high volatility and contract during consolidation, making Bollinger Bands invaluable for spotting breakouts and price extremes among indicators for intraday.
When price repeatedly touches the upper band, the asset may be overbought; touching the lower band suggests oversold conditions. In 2025, Bollinger Band squeezes—when the bands narrow—often preceded explosive breakouts in crypto and stocks. Combining Bollinger Bands with candlestick patterns or momentum indicators for intraday can help confirm trade entries and exits.
To set up Bollinger Bands, most traders use a 20-period moving average with bands set two standard deviations from the mean. Adjust these parameters based on your asset’s volatility and trading style. Remember, Bollinger Bands are not standalone; always use them with volume or momentum indicators for intraday to reduce false signals.
A sample code snippet for calculating Bollinger Bands in Python:
import pandas as pd

df['MA20'] = df['Close'].rolling(window=20).mean()
df['Upper'] = df['MA20'] + 2*df['Close'].rolling(window=20).std()
df['Lower'] = df['MA20'] - 2*df['Close'].rolling(window=20).std()
This simple script calculates the key levels you need for real-time analysis.
5. Stochastic Oscillator
The Stochastic Oscillator is a momentum-based tool that compares a security’s closing price to its price range over a set period. Among indicators for intraday, it is especially useful for identifying short-term reversals and entry points in range-bound or choppy markets.
The oscillator moves between 0 and 100. Readings below 20 indicate oversold conditions, while readings above 80 suggest overbought markets. In 2025, stochastic crossovers frequently aligned with significant moves in major forex pairs, giving traders a valuable edge.
For intraday trading, the 14-period setting is common, but many traders shorten the period for faster signals. The Stochastic Oscillator works best when paired with trend indicators for intraday, such as EMA or MACD, to avoid acting on misleading signals during strong trends.
When using the Stochastic Oscillator, look for crossovers in oversold or overbought zones for the highest probability setups. However, be aware that during powerful trends, the oscillator may remain overbought or oversold for extended periods. Always confirm signals with price action or other indicators for intraday.
6. Pivot Points
Pivot Points are calculated from the previous trading session’s high, low, and close, providing key support and resistance levels for the current day. As one of the most widely used indicators for intraday, Pivot Points help traders plan entries, exits, and stop-loss placements with precision.
Traders use the main pivot (P), along with support (S1, S2, S3) and resistance (R1, R2, R3) levels, to anticipate reversal and breakout zones. During 2025’s volatile earnings seasons, Pivot Points offered reliable frameworks for navigating unpredictable price swings.
Calculating Pivot Points is straightforward:
Pivot = (High + Low + Close) / 3
Support1 = (2 * Pivot) - High
Resistance1 = (2 * Pivot) - Low
Most trading platforms plot these levels automatically, allowing you to focus on execution.
For greater accuracy, combine Pivot Points with volume and momentum indicators for intraday confirmation. While highly effective in range-bound markets, Pivot Points may be less predictive during strong trends or news-driven spikes, so always adapt your strategy as market conditions evolve.
7. Accumulation/Distribution Line (A/D Line)
The Accumulation/Distribution Line (A/D Line) is a volume-based indicator that measures the flow of money into or out of a security. By analyzing both price and volume, the A/D Line helps confirm trend direction and spot potential reversals, making it a valuable addition to your indicators for intraday toolkit.
A rising A/D Line signals accumulation (buying pressure), while a falling line indicates distribution (selling pressure). In 2025, divergence between price and the A/D Line often predicted major reversals in leading indices, alerting traders to shifts in market sentiment before they became obvious in price action alone.
To use the A/D Line effectively, pair it with price action and other indicators for intraday such as EMA or RSI. This combination can help filter out false signals and improve trade timing across stocks, forex, and crypto.
It is important to note that the A/D Line can lag in thinly traded assets, so always monitor liquidity and use additional confirmation tools. With consistent practice, the A/D Line empowers traders to make informed decisions based on underlying market dynamics rather than price alone.
How to Effectively Use Intraday Indicators: Strategies & Best Practices
Intraday trading in 2026 is more competitive than ever, and mastering indicators for intraday can make the difference between consistent profits and costly missteps. Adopting best practices not only refines your approach but also protects your capital in rapidly changing markets.
Developing a Profitable Intraday Strategy
Building a winning edge with indicators for intraday begins with setting clear objectives and defining your risk tolerance. Choose indicators that align with your trading style and the asset class you focus on, whether stocks, forex, or crypto.
Backtesting is crucial. Run your strategies on historical data to identify patterns and fine-tune your setups. For example, pairing EMA with RSI has been effective in momentum-based scalping. Research has shown that using RSI in volatile environments, such as cryptocurrency markets, can improve timing and decision-making. Explore the Effectiveness of RSI in Cryptocurrency Markets for in-depth insights.
Keep a detailed trading journal. Document every trade, noting which indicators for intraday contributed to your decisions and the outcomes. This habit accelerates learning and strategy refinement.
Managing Risk with Indicators
Risk management is the cornerstone of sustainable trading. Leverage indicators for intraday to define stop-loss and take-profit points before entering any position. For instance, combining Parabolic SAR with EMA can help you set dynamic trailing stops in fast markets.
Position sizing should adapt to current market volatility, as signaled by your chosen indicators. Avoid overtrading when setups are weak or ambiguous. Many successful traders use Moving Average Convergence Divergence Overview to time entries and exits, minimizing drawdowns.
Data consistently shows that traders using indicators for intraday with strict risk protocols outperform others by a significant margin. Make risk controls a non-negotiable part of your routine.
Adapting to Market Conditions in 2026
Markets in 2026 demand flexibility. Indicators for intraday must be tuned to shifts in volatility, liquidity, and news flow. Regularly review and adjust indicator parameters to stay aligned with evolving market dynamics.
Modern traders increasingly rely on AI and automation to process signals in real time. For example, algorithmic trading systems can instantly react to indicator triggers, capturing fleeting opportunities. Stay proactive by integrating new tools and continuously expanding your knowledge.
Journaling market changes and your response to them ensures you adapt quickly. Indicators for intraday are most effective when strategies evolve alongside the market.
Common Pitfalls and How to Avoid Them
Many traders fall into the trap of overcomplicating their setups. Using too many indicators for intraday can lead to confusion and missed opportunities. Focus on a core set, and always look for confirmation between signals.
Ignoring the broader market context or failing to adapt to new technologies can hinder your performance. For example, traders who overlooked AI-driven trends in 2025 underperformed their peers. Stay disciplined, stick to strategies you have tested, and remain open to innovation.
By sidestepping these pitfalls, you ensure that your use of indicators for intraday remains sharp, relevant, and profitable.
Advanced Tools & Technology: The Future of Intraday Indicators
The landscape surrounding indicators for intraday trading is evolving rapidly, fueled by technological breakthroughs and the rise of artificial intelligence. Today, traders have access to smarter, faster, and more adaptable tools than ever before. Staying ahead means leveraging these innovations to enhance precision, speed, and consistency in your trading approach.
AI-Powered Trading Indicators
Artificial intelligence is revolutionizing indicators for intraday trading. AI-driven tools process vast streams of real-time data, instantly identifying patterns and generating actionable signals. These indicators for intraday use adapt to shifting market dynamics, offering traders a decisive edge. For example, machine learning models can anticipate trend reversals before traditional signals appear, increasing win rates.
If you want to dive deeper into how machine learning enhances trading performance, check out Decision Trees for Intraday Trading Strategies for a research perspective on integrating AI with technical indicators. While AI brings speed and adaptability, remember that robust risk controls are essential to avoid over-reliance on automation.
Multi-Timeframe Analysis
Successful traders know that aligning indicators for intraday signals across multiple timeframes improves decision-making. Multi-timeframe analysis compares trends on the 1-minute, 5-minute, and hourly charts, helping you avoid trading against the dominant market flow.
Modern trading platforms now make it easy to visualize and synchronize these signals. By confirming setups across several timeframes, you can filter out false signals and boost the accuracy of your indicators for intraday strategies. Multi-timeframe confirmation is proven to raise trade success rates, especially in volatile markets.
PipTrend: AI-Powered Real-Time Trading Indicator
PipTrend is reshaping the way traders use indicators for intraday strategies. This AI-powered tool delivers instant buy and sell signals for stocks, forex, crypto, and indices. With real-time, multi-timeframe analysis and customizable alerts, PipTrend simplifies complex market data into clear, actionable insights.
Integration with TradingView ensures you never miss fast market moves. PipTrend supports both new and experienced traders by providing steady, confident trading decisions. Continuous updates, an exclusive community, and responsive support make it a leading choice for those seeking reliable indicators for intraday trading.
Integrating Indicators with Algorithmic and Automated Trading
The integration of indicators for intraday trading with algorithmic systems is now mainstream. Platforms like TradingView allow you to automate strategies using scripts that trigger trades based on indicator signals. This automation boosts speed, ensures emotional neutrality, and supports scalable trading.
However, successful automation requires vigilant monitoring and regular updates to algorithms. As AI and machine learning continue to advance, we can expect even more sophisticated automation of indicators for intraday strategies, further enhancing efficiency and consistency for active traders.
After exploring the most effective indicators for intraday trading in 2026, you can see how critical clear, real-time signals are for making confident decisions. That’s exactly where PipTrend shines—combining advanced AI with instant alerts and multi-timeframe analysis to help you respond to market moves as they happen. Whether you’re new to trading or refining your edge, PipTrend gives you the clarity and simplicity you need for consistent results. If you’re ready to take the guesswork out of your trades and truly elevate your strategy, See Your Trading Improve With PipTrend.