Trading Options Signals: A Beginner's Risk Framework
On this page
What Are Trading Options Signals, Really?
Two traders get the same alert: “Bullish on AAPL.” One makes 40%. The other loses half their premium.
Both read the signal correctly.
That gap is the whole story of trading options signals.
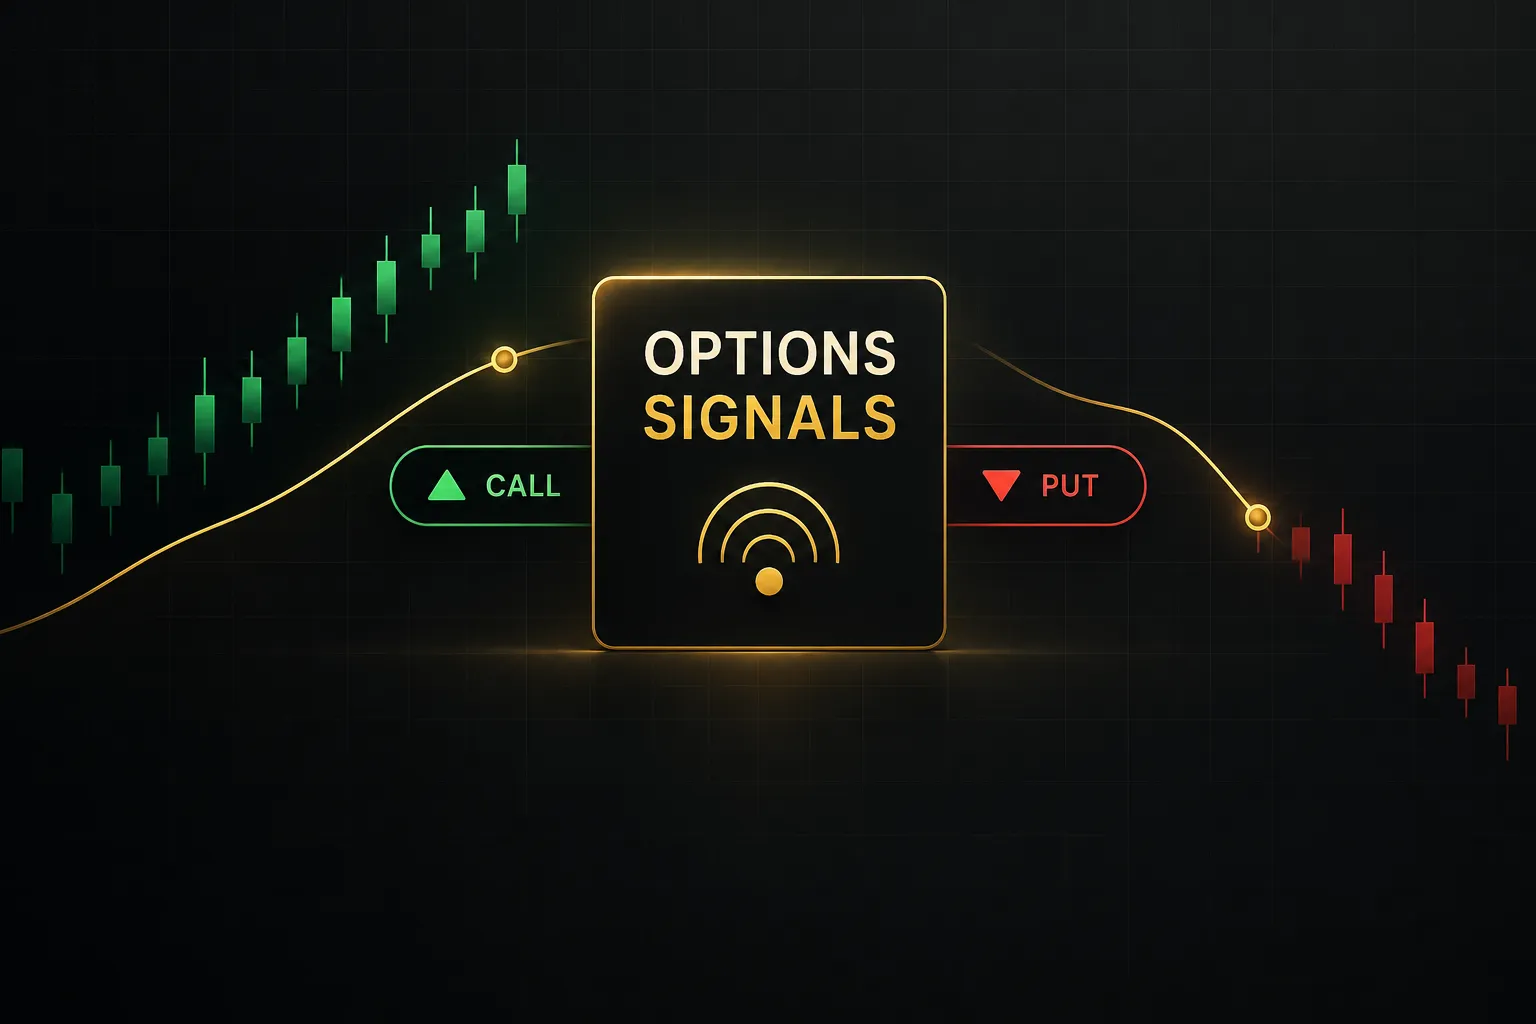
An options signal is an alert that suggests a potential trade on a specific contract or underlying asset.
It is a hypothesis, not a guaranteed outcome.
And it differs from a generic stock or chart signal in one important way: options add layers of variables that a simple “price will go up” call never addresses.
Consider a bullish signal on a $100 stock. You could buy a call option at the $100 strike expiring in 45 days, or a $110 strike expiring Friday. If the stock climbs to $103 over two weeks, the first contract likely profits.
The second probably expires worthless.
Same direction.
Same accuracy.
Completely different result.
The strike price, expiration date, implied volatility, and the quality of the bid-ask spread all decide whether a correct call becomes a profit, a breakeven, or a loss.
This guide gives you a repeatable framework to convert any signal into a contract-specific, risk-defined trade. You’ll learn what a complete signal looks like, why correct calls still lose money, how to match contracts to signals, and how to judge the people selling them.
No signal, including rule-based systems like PipTrend, provides personalized financial advice or guarantees an options result. A signal starts the decision. You finish it.
What Makes a Signal Legitimate?
Most alerts you’ll see online answer one question: up or down?
That’s useful.
But for options, it’s maybe 30% of the information you need to place a sensible trade.
A legitimate signal is transparent about its source, specific about the contract, and honest about when it’s wrong. Before judging quality, though, you need to know which type of signal you’re looking at.
Six Types You’ll Encounter
Each signal type draws on different data, and each has blind spots. Here’s how they differ:
- Technical indicator signals come from price-based tools like moving average crossovers, RSI, MACD, or trend filters applied to the underlying stock. They suggest direction and timing but say nothing about which strike or expiration to use.
- Unusual options activity flags contracts trading at volumes far above their normal levels or open interest. A sudden 10,000-contract print on a strike that usually trades 500 might hint at informed positioning, or it might be a hedge you can’t see the other side of.
- Options flow tracks the stream of large orders, sweeps, and block trades in real time. It shows where big money is moving, but a single bought call could be one leg of a complex spread, so context is easy to misread.
- Sentiment signals measure crowd mood through put/call ratios, social media chatter, or survey data. They often work best as contrarian indicators at extremes rather than as standalone entry triggers.
- Volatility signals compare implied volatility against historical volatility or track IV rank and percentile. These help you decide whether options are cheap or expensive, which matters as much as direction.
- Broker-connected automation routes signals directly into orders through an API or platform integration. Speed improves, but automation also executes bad signals instantly and without second thoughts.
Notice the pattern.
A stock chart signal only tells you direction. It says nothing about which contract, strike, or expiration fits the expected move.
That translation is your job.
The Anatomy of a Complete Signal
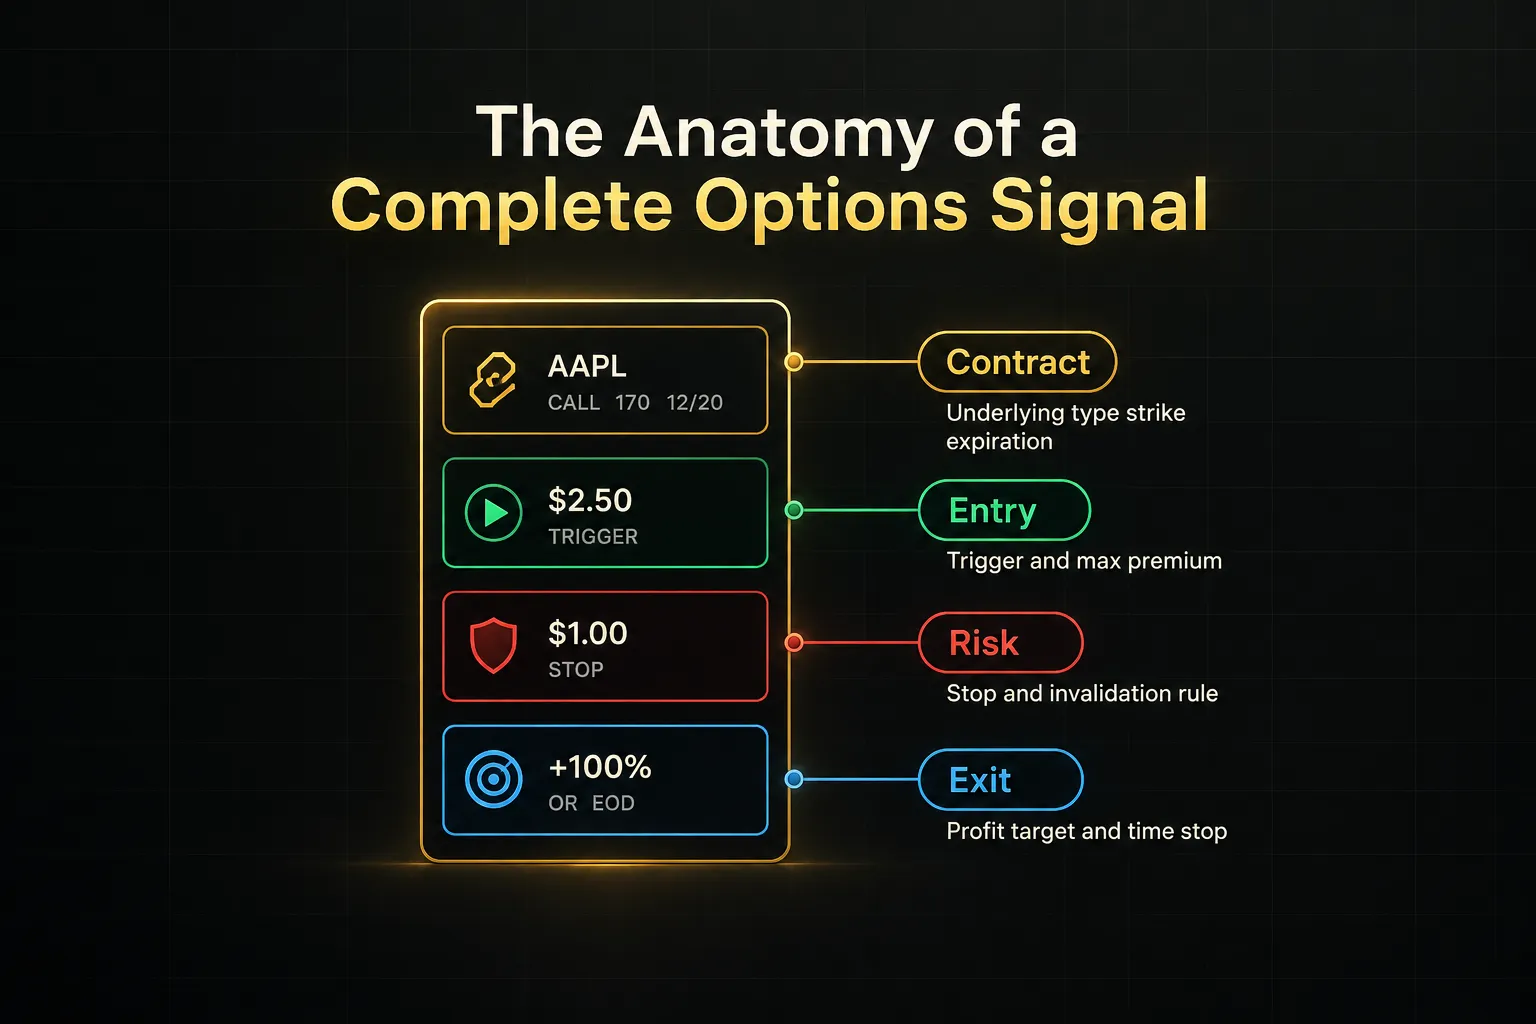
Here’s the uncomfortable truth: most free or paid alerts stop at direction and skip the contract-specific details that determine profitability. A complete options signal should include every one of these elements:
- Underlying: The stock, ETF, or index the option is based on, such as SPY or MSFT.
- Option type: Whether it’s a call or a put option, or a defined structure like a vertical spread.
- Strike: The exact strike price, ideally with its approximate delta so you understand the probability profile.
- Expiration: The specific date, chosen to cover the expected duration of the move with room to spare.
- Entry trigger: The condition that activates the trade, like a close above a level or a confirmed breakout on a set timeframe.
- Acceptable premium: A maximum price you’ll pay, such as “fill at or below $2.40,” so you don’t chase.
- Stop condition: The point where you exit for a loss, defined by option price, underlying price, or both.
- Profit target: A specific exit level or percentage gain where you take money off the table.
- Time-based exit: A rule like “close by 14 days to expiration” to avoid the steepest theta decay.
- Invalidation rule: The event that kills the thesis entirely, such as the underlying closing back below support.
If an alert gives you two of these ten, you’re not receiving a trade.
You’re receiving an opinion.
Why a Correct Call Can Still Lose Money
Being right about direction is the minimum requirement in options, not the finish line. Plenty of beginners have watched a stock move exactly as predicted while their position sank. It feels like the market cheated.
It didn’t.
Options are priced on several forces at once.
Direction is one.
Time, volatility, and execution quality are the others, and each can quietly drain a winning idea.
Theta, Delta, and Vega in Plain Terms
Theta measures time decay, the amount of value an option loses each day if nothing else changes.
Think of it as a melting ice cube.
An at-the-money option with 45 days left might lose $0.04 a day, but the same option with 7 days left could lose $0.15 or more. The melt accelerates as expiration approaches, and it happens whether your direction is right or wrong.
Delta estimates how much the option’s price moves for each $1 move in the stock.
Here’s where beginners get burned.
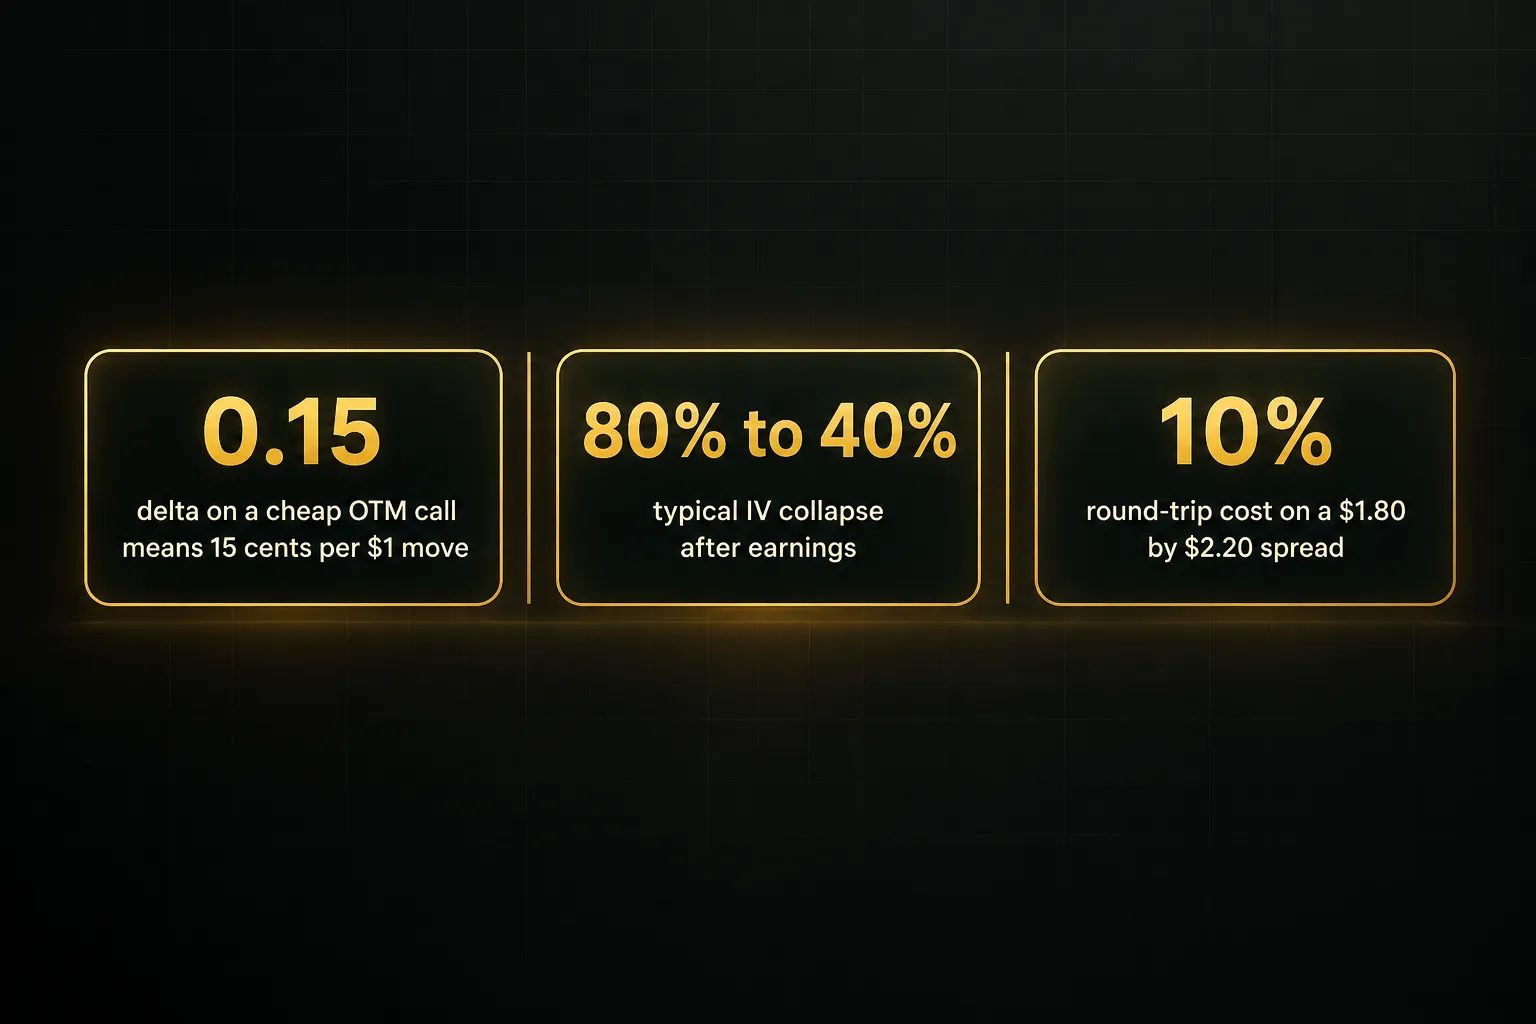
A cheap out-of-the-money call with a 0.15 delta gains roughly $0.15 per $1 the stock rises.
So the stock moves up $2, exactly as signaled. Your option gains about $0.30 in theory. Subtract three days of theta at $0.08 each, and you’ve made six cents.
Maybe nothing at all after fees.
That’s delta mismatch: the stock moves correctly, but your contract barely responds.
Vega measures sensitivity to changes in implied volatility. When IV rises, options get more expensive. When IV falls, they get cheaper, even if the stock price stays put.
And that leads to the most painful trap of all.
The Implied Volatility Trap
Before earnings, implied volatility often inflates as traders pay up for potential big moves. A stock might carry 80% IV the day before a report. The morning after, it can collapse to 40%.
This is IV crush.
Picture buying a call before earnings. The company beats, the stock rises 4%, and your call… drops 20%. The vega loss from IV halving outweighed the delta gain from the price move.
You were right on the news and wrong on the price you paid for it.
Directional accuracy doesn’t protect you from overpaying for volatility. If the market already priced in a big move, a modest move loses money.
Then there’s execution drag.
Wide bid-ask spreads mean you start every trade underwater. An option quoted at $1.80 bid and $2.20 ask costs you roughly 10% just to enter and exit at mid-market, and more if you cross the spread.
Slippage compounds this.
Many signals reach subscribers seconds or minutes after generation, and by the time you fill, the premium may have jumped 15%. In thinly traded contracts, everyone acting on the same alert pushes the price against you.
Theta, delta, vega, and execution: four ways to be right and still lose. A good framework addresses all four before you click buy.
Matching the Contract to the Signal
The signal tells you where.
The contract decides how much you’ll actually make getting there.
This is the step most traders skip, and it’s where the real edge lives.
Picking Strike and Expiration
Start with delta as your strike selector. For directional signals, a 0.30 to 0.50 delta range balances cost and responsiveness.
A 0.50 delta option sits near the money and moves about half as much as the stock. A 0.30 delta option is cheaper but needs a bigger move to pay off.
Avoid the lottery-ticket temptation of 0.10 delta contracts. They look cheap, but they need dramatic moves to profit, and most expire worthless.
For expiration, match the time horizon to the signal’s expected duration, then add a buffer. If a daily-chart signal typically plays out over 10 to 15 trading days, buy at least 30 to 45 days of time.
That buffer keeps you out of the steepest part of the theta curve and gives the thesis room to breathe if it starts slowly.
Check the options chain before committing.
Look for open interest above a few hundred contracts and a bid-ask spread under about 5% of the option’s price. If liquidity is thin, a different strike or expiration may serve you better than the “ideal” one.
Spreads vs Long Calls and Puts
Buying an outright call or put is the simplest expression of a signal. It’s also the most exposed to theta and IV swings.
A vertical spread reduces both by pairing a long option with a short one at a different strike.
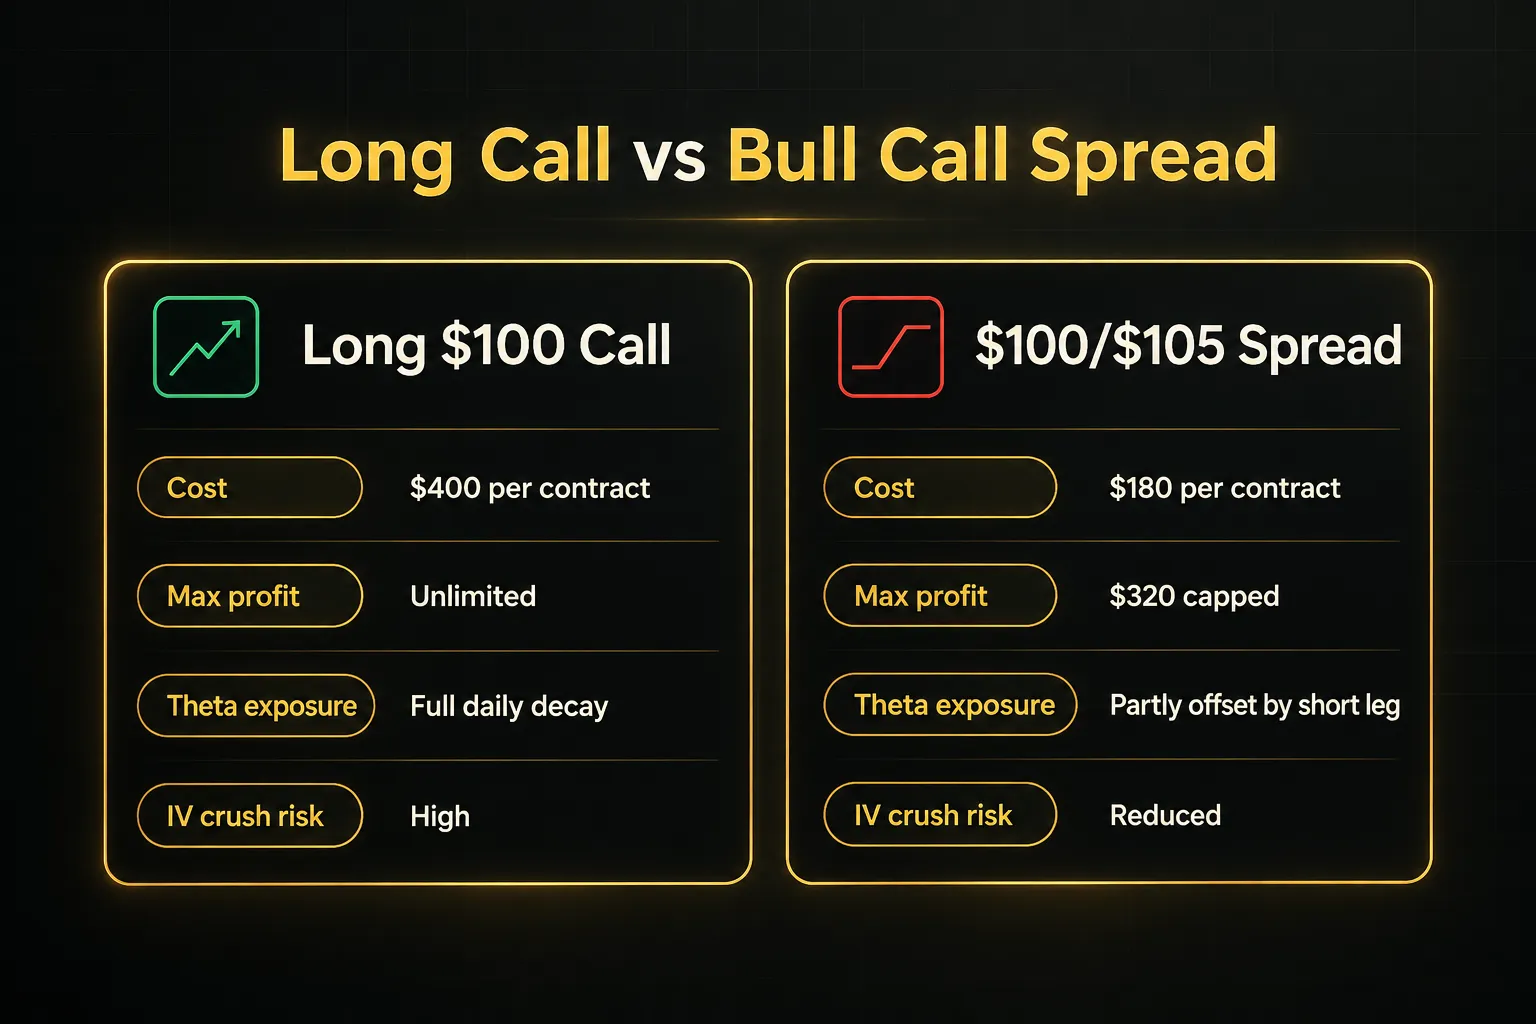
Here’s a concrete comparison on a bullish signal with the stock at $100:
- Long $100 call: costs $4.00, or $400 per contract. Unlimited upside, but you lose the full $400 if the stock stays flat through expiration.
- $100/$105 bull call spread: buy the $100 call, sell the $105 call, net cost $1.80, or $180. Maximum profit is $320 (the $5 width minus $1.80), reached if the stock closes at or above $105.
The spread caps your upside.
But it cuts your cost by more than half, and because the short leg offsets some theta and vega, a drop in implied volatility hurts far less.
For beginners, that tradeoff is usually worth it.
0DTE: Opportunity or Trap?
Zero-days-to-expiration options have exploded in popularity. According to Cboe data, 0DTE contracts now account for more than half of daily SPX options volume as of 2025 and into 2026.
The appeal is obvious: cheap premiums and fast results.
But the mechanics are brutal.
Gamma, the rate at which delta changes, spikes near expiration. A 0DTE option can swing from 0.20 delta to 0.80 delta in an hour, turning small stock moves into enormous percentage gains or total losses.
Theta burn is equally extreme. An option can lose most of its remaining time value in the final few hours of the session.
Expiration-day mechanics add more risk, including assignment issues on short legs and the chance of a contract finishing a few cents in or out of the money.
For most beginners, 0DTE is a trap without strict risk rules. If you trade it at all, use defined-risk spreads, tiny sizes, and hard time stops.
Which brings us to sizing.
Risk a small, fixed percentage of account capital per signal, commonly 1% to 2%, not a fixed contract count. On a $10,000 account, 1% means $100 of maximum loss. That might be one spread or zero long calls, depending on the setup.
Size by dollars at risk, never by how many contracts feel right.
Judging a Signal Provider
A signal service sells you confidence.
Your job is to find out whether that confidence is earned.
Most providers won’t make this easy, so you need to know what to look for.
Red Flags of Signal Integrity
The first and most damaging issue is repainting. A repainting indicator changes its past signals after new price data arrives, so the chart always looks perfect in hindsight. A buy arrow that appeared at a bad price simply vanishes and reappears somewhere better.
Backtests built on repainting tools are fiction.
Watch for hindsight-adjusted entries, where the posted entry price is better than anything a subscriber could have realistically filled. Cherry-picked screenshots of big winners, with no record of the losers, are another classic tell.
Deleted losing trades are worse still.
If a provider’s Discord or Telegram history has gaps, ask why. Delayed or revised alerts, such as a “correction” posted after the move happened, are a sign the record is being curated rather than reported.
Metrics Beyond Win Rate
An 80% win rate sounds impressive.
It means nothing on its own.
If the average win is $50 and the average loss is $300, that 80% strategy loses money over time.
The metric that matters is expectancy: (win rate × average win) minus (loss rate × average loss). Using the example above, 0.80 × $50 = $40, and 0.20 × $300 = $60. Expectancy is negative $20 per trade.
Not even close to profitable.
Beyond expectancy, ask for these numbers:
- Average win versus average loss, so you can see the payoff ratio directly.
- Maximum drawdown depth, the largest peak-to-trough decline, which tells you how much pain you’d endure.
- Longest losing streak, because eight losses in a row will test any trader’s discipline.
- Sample size, since 30 trades proves little while 200 or more starts to mean something.
- Live versus hypothetical results, as backtests ignore slippage, fills, and emotion.
Remember too that a provider’s risk profile may not match yours. Their account size, risk tolerance, and ability to watch screens all day shape how they trade.
A signal is one input, not an instruction to copy blindly.
Rule-Based Design Done Right
What does transparency look like in practice? PipTrend offers one example.
Its signals are non-repainting, meaning once an alert prints, it stays fixed on the chart. It also uses multi-timeframe confirmation, requiring agreement across timeframes before a signal triggers, which filters out a lot of noise.
PipTrend publicly posts its cTrader results, including losses.
That matters.
A provider willing to show its red trades gives you the raw data to calculate expectancy and drawdown yourself, instead of trusting a marketing claim.
But be precise about scope.
PipTrend is designed for underlying-asset direction. It is not an options-specific signal, so it won’t tell you which strike, expiration, or structure to use.
That’s where the contract-matching framework above comes in: a solid directional signal paired with your own options analysis.
Frequently Asked Questions
Do options trading signals really work?
Options trading signals can work, but only when the signal has positive expectancy and you translate it into the right contract. A directional alert with a 55% hit rate can still lose money if you buy low-delta options, overpay for implied volatility, or size too large.
The signal provides an idea.
Contract selection, position sizing, and execution decide the result.
What is the best indicator for options trading?
No single indicator is best, but implied volatility rank is the most options-specific tool you can add.
Directional indicators like moving averages or RSI tell you where price might go. IV rank tells you whether options are cheap or expensive, which shapes whether you should buy outright options or use spreads.
How do you read an options trading signal?
Read an options signal by checking it against a complete template: underlying, option type, strike, expiration, entry trigger, maximum premium, stop, target, time exit, and invalidation rule. If any element is missing, fill it in yourself using delta targets, the options chain, and your risk limits before placing the trade.
Are options signals worth it?
Options signals are worth it only if the provider shows verified live results with positive expectancy across a meaningful sample. Paying $100 a month for alerts that lack contract details, hide losses, or rely on repainting indicators rarely pays off.
Free, transparent, rule-based signals often beat expensive, opaque ones.
Can you make money following trading signals?
You can make money following trading signals, but blind copying is the least reliable way to do it.
Fill prices, timing delays, and account size differences mean your results will differ from the provider’s. Traders who profit typically use signals as one input and apply their own sizing and exit rules.
What is the safest way to trade options for beginners?
The safest way for beginners to trade options is paper trading first, then small defined-risk spreads. Practice on a simulated account for at least a few months.
When you go live, use vertical spreads with known maximum losses, risk 1% to 2% of capital per trade, and avoid 0DTE contracts until you have a tested plan.
Turn Signals Into a Plan, Not a Shortcut
Here’s the decision rule.
If you’re a beginner, start with paper trading and defined-risk spreads. Track every simulated trade for expectancy, drawdown, and how often your contract choice helped or hurt a correct signal.
If you’re intermediate, use signals as one input alongside your own Greeks and liquidity checks. Confirm delta, theta, and vega exposure.
Check the bid-ask spread and open interest. Compare implied volatility to historical volatility before you pay up.
Either way, the process looks the same:
The traders who last aren’t the ones with the best alerts.
They’re the ones with the best rules for what happens after the alert arrives.
A signal only starts the decision process. The trade plan finishes it.
Treat every alert as a question rather than an answer.
Then make sure your plan, not your excitement, writes the reply.
Sources
Risk Disclaimer: Trading involves risk. Past performance doesn't guarantee future results. Only trade with money you can afford to lose. PipTrend is a tool to assist your trading decisions, not financial advice.