Heikin Ashi Explained: Reading Trends Without Guesswork
On this page
Why Traders Turn to Heikin Ashi
Open a five-minute chart on any liquid market and you will see the same thing: a mess. Green candle, red candle, long wick, doji, three more flips in ten minutes.
The trend is probably there.
You just cannot see it through the market noise.
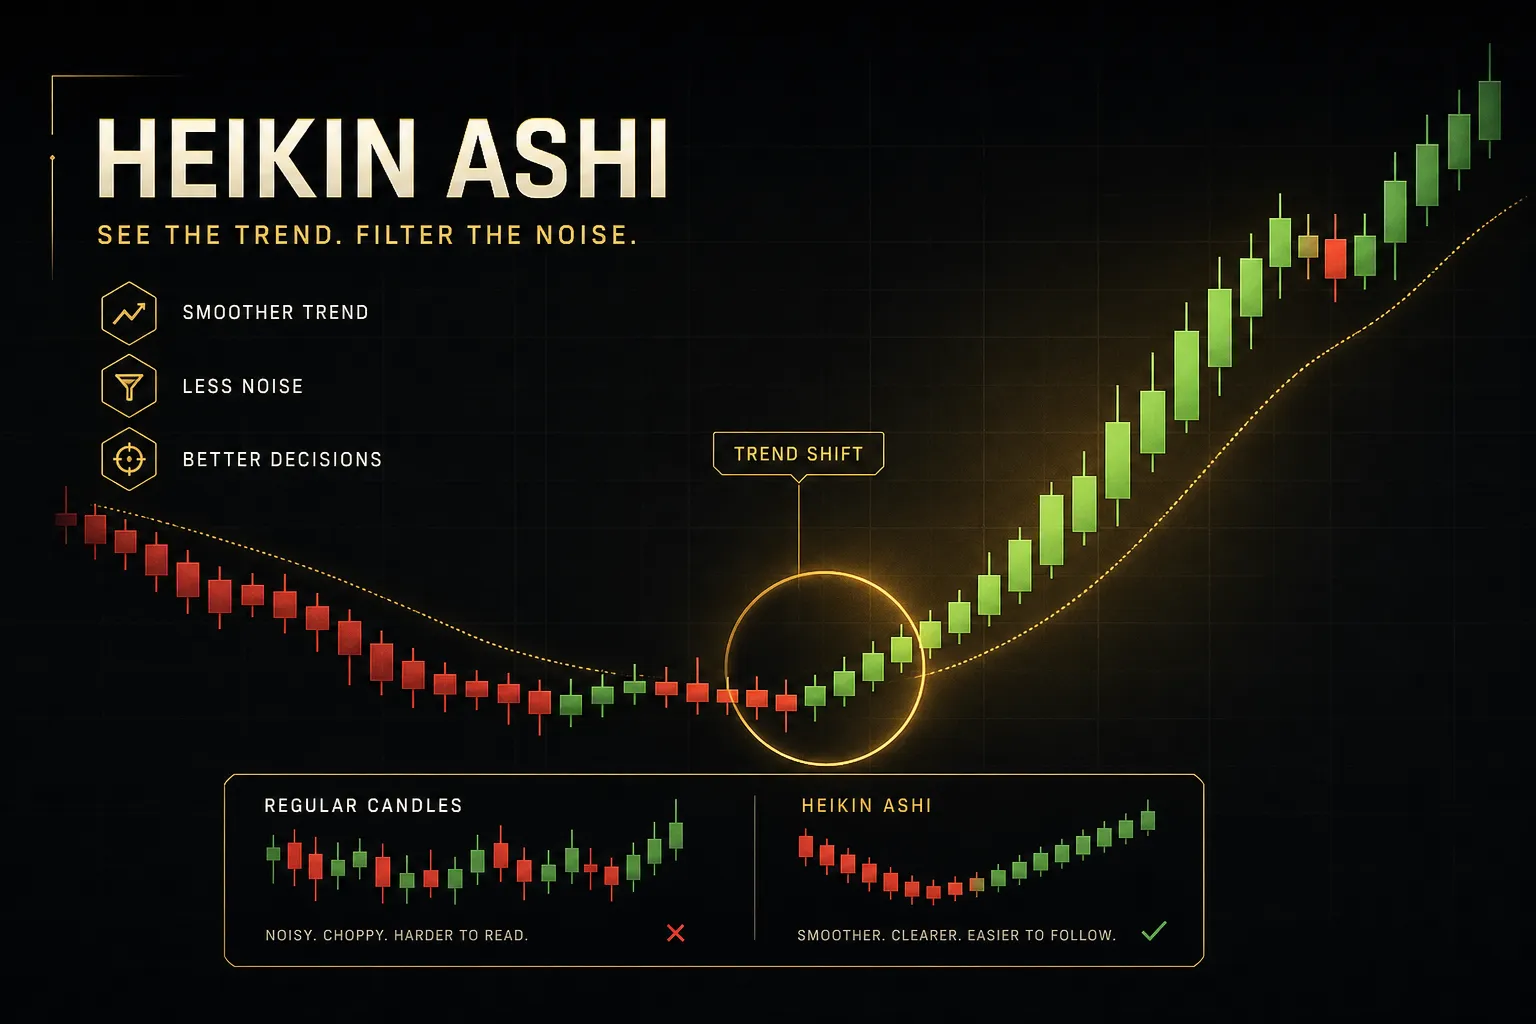
That is the problem Heikin Ashi was built to solve. It takes a standard Japanese candlestick chart and runs the prices through an averaging formula, producing candles that change colour far less often and make direction obvious at a glance.
But here is where most guides stop, and where most traders get hurt.
Heikin Ashi is a trend-reading tool, not a buy and sell system. The candles you see on screen are not prices anyone can trade at.
They are averages.
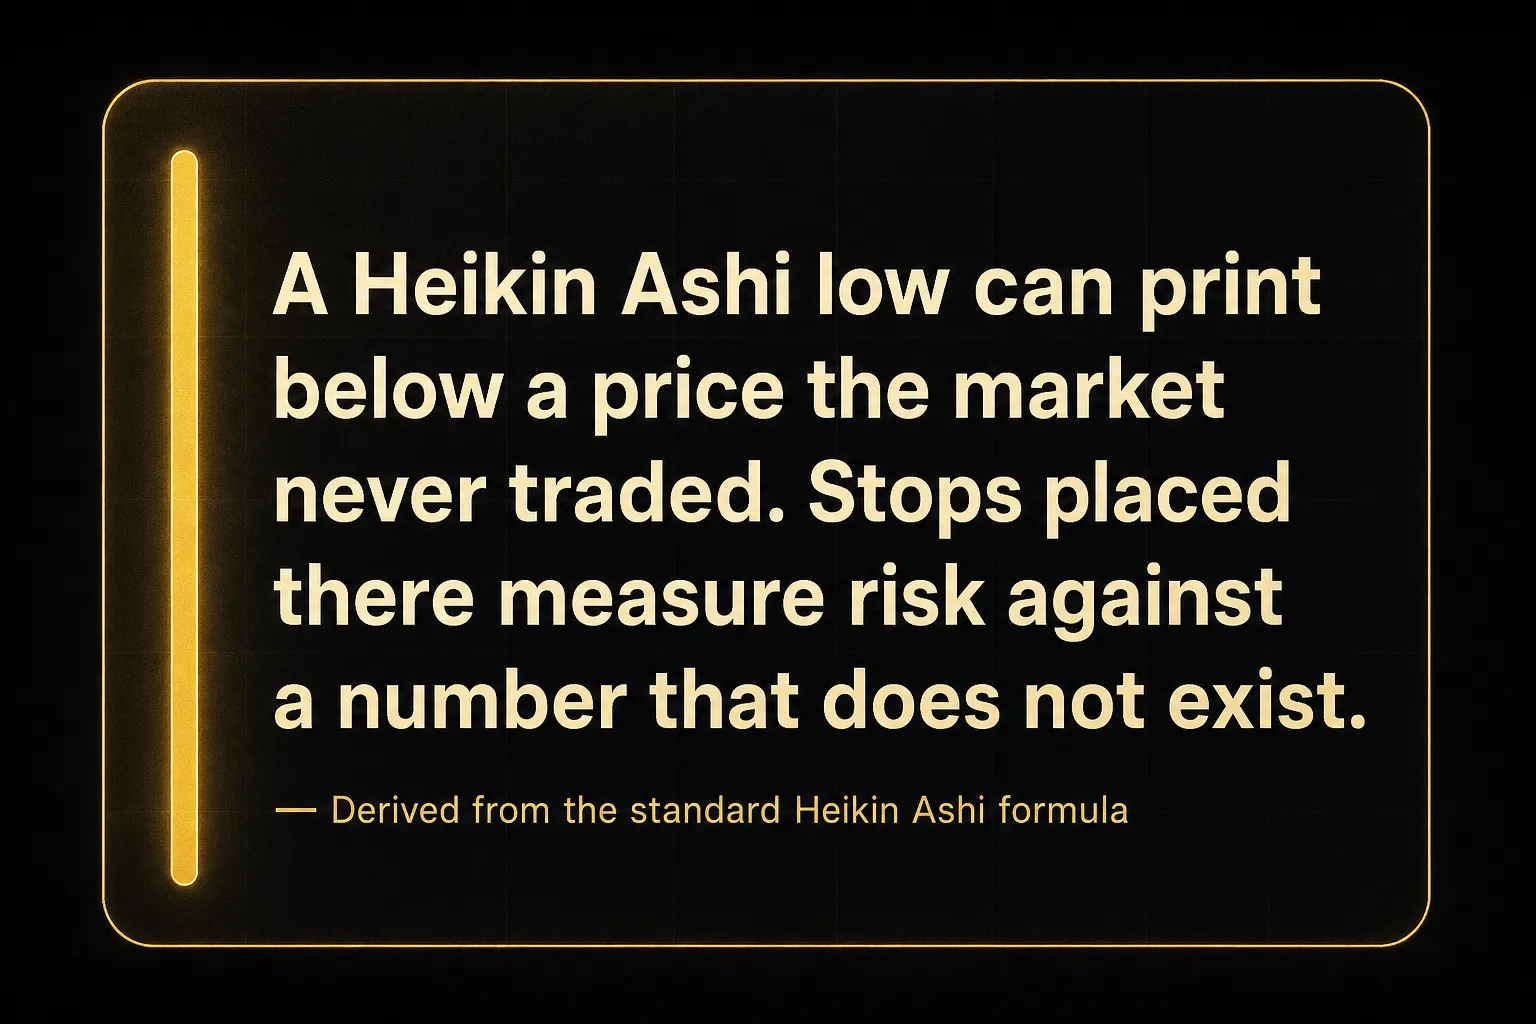
A Heikin Ashi low can sit below a level the market never actually touched, and if you place a stop there, you are measuring risk against a number that does not exist.
This guide covers the whole picture: how the candles are calculated (with a worked example you can check yourself), how to read bodies and wicks, the synthetic price trap and how to avoid it, a four-step workflow that keeps execution on real prices, and an honest answer on lag, repainting, and backtesting bias.
What Is Heikin Ashi?
Heikin Ashi is a charting technique that replaces each candle’s open, high, low, and close with values derived from a moving average of current and prior price data. The result is a smoothed chart that filters short-term fluctuations while preserving overall trend direction.
It is not an indicator you overlay on a chart.
It replaces the chart itself.
The Meaning Behind the Name
The term comes from Japanese and translates roughly to average bar or “average pace”. You will see it written as Heikin Ashi, Heiken Ashi, and occasionally Heikin-Ashi with a hyphen.
All three refer to the identical method, and the spelling difference is just romanisation, nothing more.
The name is accurate in a way most technical analysis jargon is not. Every candle really is an average bar, built from four averaged numbers rather than four traded prices.
How the Candles Are Calculated
The Heikin Ashi formula uses four equations, and each new candle depends on the one before it:
- HA Close = (Open + High + Low + Close) / 4, using the current bar’s real prices
- HA Open = (prior HA Open + prior HA Close) / 2
- HA High = the highest of the real high, the HA Open, and the HA Close
- HA Low = the lowest of the real low, the HA Open, and the HA Close
Work through one bar and it clicks.
Say the previous Heikin Ashi candle had an HA Open of 100.00 and an HA Close of 101.00. The current real candle prints an open of 101.20, a high of 102.40, a low of 100.80, and a close of 102.10.
HA Close comes out at (101.20 + 102.40 + 100.80 + 102.10) / 4, which equals 101.63. HA Open is (100.00 + 101.00) / 2, or 100.50.
HA High is the largest of 102.40, 100.50, and 101.63, so it stays at 102.40. HA Low is the smallest of 100.80, 100.50, and 101.63, giving 100.50.
Look closely at that last number.
The market’s actual low was 100.80. The Heikin Ashi low is 100.50, thirty cents below a price that never printed.
That gap is the whole reason for the warning later in this guide.
Heikin Ashi vs Regular Candlesticks
A standard candlestick shows exactly what happened: where price opened, how far it stretched in both directions, where it settled.
Nothing is filtered.
Gaps between sessions appear as visible breaks, and a single violent bar looks violent.
Heikin Ashi does the opposite.
Because each open is the midpoint of the prior candle’s body, consecutive candles always touch. Gaps disappear entirely, absorbed into the averaging.
The trade-off is honest and worth stating plainly: you gain clarity on direction and lose precision on price.
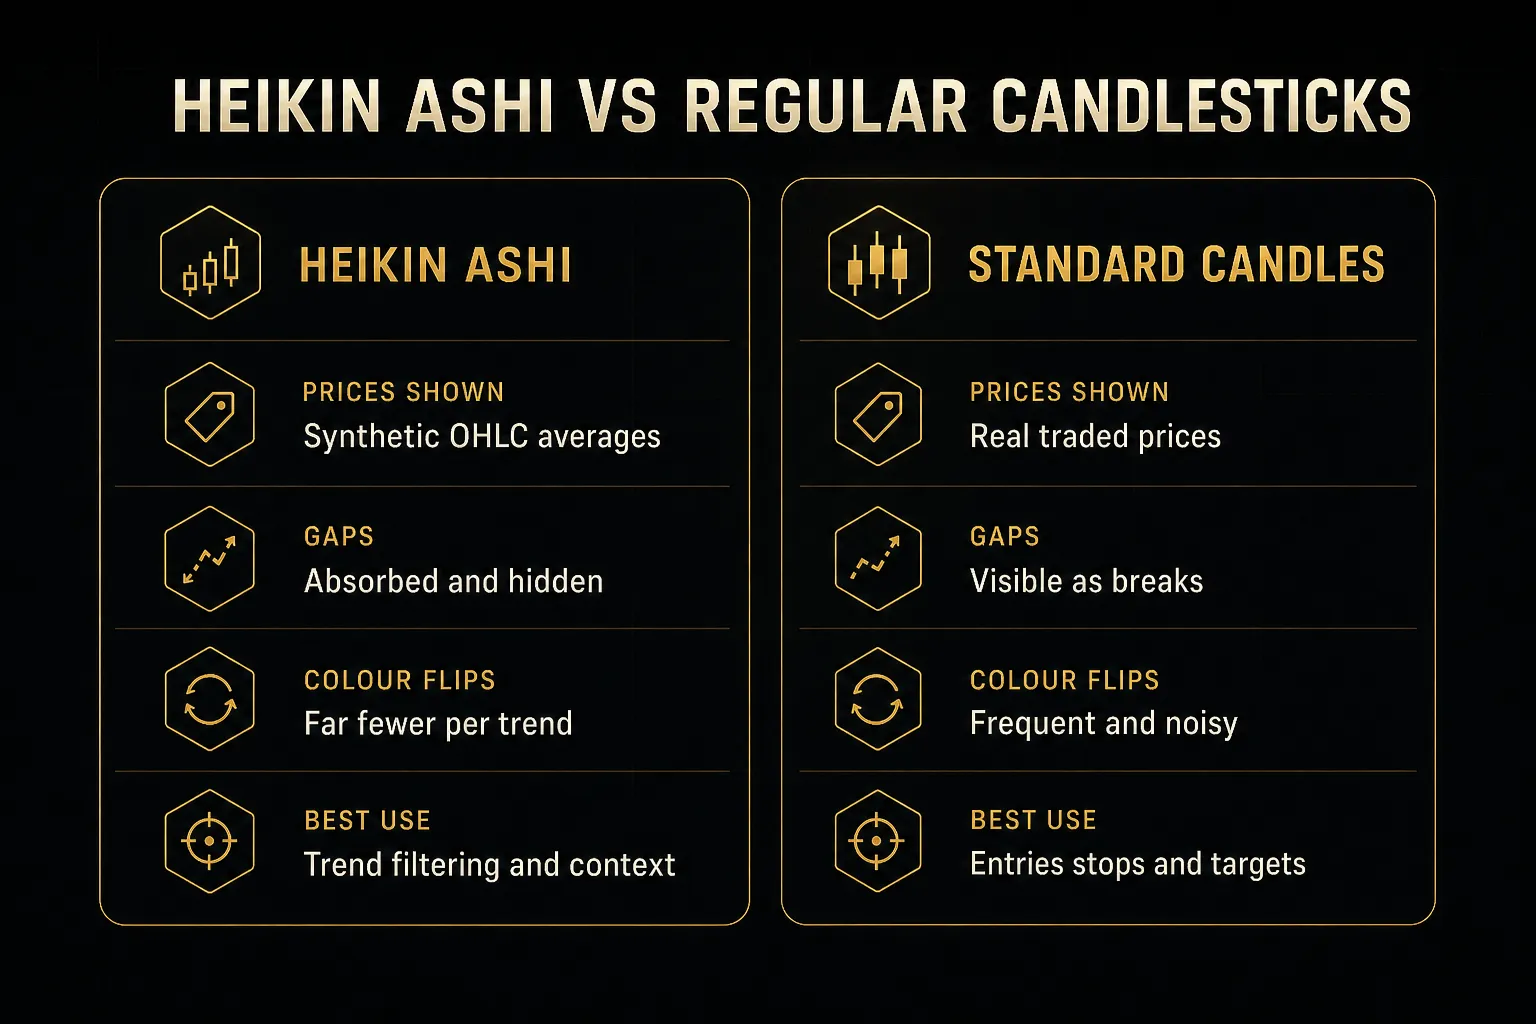
In practice, a trending market that produces fourteen colour changes on standard candles might produce three or four on Heikin Ashi over the same span.
That reduction is the entire value proposition.
Fewer flips, fewer false trend reads, less second-guessing.
Switching is trivial on most platforms.
In TradingView, click the chart type selector in the top toolbar (the icon showing candle shapes), then choose Heikin Ashi from the dropdown. The underlying instrument, timeframe, and price data are unchanged; only the visual construction of the bars is different.
One consequence catches people out.
Indicators calculated on the chart will now read Heikin Ashi values, not real ones, on many platforms. Your RSI, MACD, or moving average will be computed from smoothed inputs, which makes them look cleaner and more accurate than they truly are.
Check your platform’s behaviour before you trust an oscillator reading on a Heikin Ashi chart.
How to Read Heikin Ashi Candles
Reading Heikin Ashi comes down to three things: colour sequence, candle body size, and wick placement. The signals are simple, but the interpretation rules matter more than the patterns themselves.
Green and Red Candles
Colour on a Heikin Ashi chart carries more weight than on a standard chart because it flips less often. A run of consecutive candles in one direction is the core read.
- Consecutive green candles with growing bodies signal sustained bullish momentum. Each new average close is pushing further above the prior body midpoint, which only happens when buyers keep paying up.
- Consecutive red candles with growing bodies signal sustained bearish momentum. The same mechanic in reverse: sellers are consistently closing the bar below the midpoint of the last one.
- Shrinking bodies within a coloured run warn that the move is losing force. The trend may still be intact, but the rate of change is slowing, and this often precedes consolidation rather than an immediate trend reversal.
- Small bodies with wicks on both ends form the Heikin Ashi indecision candle, the rough equivalent of a doji. It marks a genuine pause where neither side controlled the averaging.
No-Wick Candles Explained
The absence of a wick is the strongest single signal Heikin Ashi produces, and it has a precise mechanical meaning.
- A green candle with no lower wick means the HA Open equalled the HA Low. Price never traded meaningfully below the opening average during that period, which is textbook trend continuation. In strong uptrends, five to ten of these can print in a row.
- A red candle with no upper wick is the mirror image. The HA Open sat at the HA High, and sellers controlled the entire bar. Downtrends often produce these in clusters before an exhaustion phase.
- A candle with wicks on both ends tells you the averaged price moved beyond both the open and close of the smoothed body. Control was contested.
- The disappearance of no-wick candles after a long run is a more reliable early warning than the first opposite-coloured bar. Wicks returning to the trend side mean the market is being pushed back.
Here is the discipline that separates profitable Heikin Ashi users from frustrated ones: one opposing candle is not a reversal.
In a strong trend, a single red bar inside a green sequence usually reflects a pullback or a brief consolidation. Two or three consecutive opposing candles with expanding bodies is a signal worth acting on.
One is noise wearing a costume.
Wicks Across Market Conditions
Wick analysis only makes sense in context. The same wick length means different things depending on what the market is doing.
- Strong trending conditions: wicks are short and consistently on one side. Bodies dominate the candle. Colour changes are rare, often fewer than three across a fifty-bar stretch, and each pullback resolves within one or two bars.
- Ranging or choppy conditions: wicks lengthen on both ends and colour flips every two to four bars. This is Heikin Ashi telling you there is no trend to filter. Trading colour changes here is the fastest way to bleed an account through repeated whipsaws.
- Volatile or gapping conditions: this is the dangerous one. Because the averaging absorbs gaps, an overnight news gap of three percent can appear as a moderately sized candle rather than a shock. The chart looks calm while the actual market structure has broken. Always cross-check the standard chart after a gap event.
- Low liquidity sessions: thin volume produces erratic real candles, and the smoothing can make a directionless market look like a clean drift. Pair with volume confirmation before treating any low-liquidity trend as real.
The Synthetic Price Trap
Go back to the worked example.
The Heikin Ashi low was 100.50. The market’s real low was 100.80.
If you placed a stop at 100.45, “just below the candle low”, you were actually placing it 35 cents below where the market ever went, and your real risk was larger than you calculated.
Scale that error across a portfolio and it stops being cosmetic.
Why Chart Prices Aren’t Real
Every Heikin Ashi value is a calculation. The close is an average of four real numbers, the open is an average of two prior averages, and the high and low are conditional picks between real and synthetic values.
This is synthetic OHLC data.
No broker will fill you at a Heikin Ashi close. No exchange order book contains a Heikin Ashi high.
Those numbers exist only inside your charting software.
Heikin Ashi answers the question “which way is this market going?” It cannot answer “at what price should I act?” Those are different jobs, and mixing them is where accounts get damaged.
The consequences show up in three specific ways.
First, distance miscalculation: your stop looks like it sits at a sensible distance from entry, but measured against real prices it is either too tight or too wide, corrupting your position sizing. Second, premature stop-outs: a stop placed at a synthetic level that the market has never respected has no structural protection behind it. Third, slippage surprises: limit orders keyed to Heikin Ashi levels may sit unfilled while price moves away, or fill far from where the chart suggested.
There is also a subtler issue that ruins strategy testing. Because the HA Close incorporates the current bar’s real close, and the HA Open depends on the prior bar, backtests that assume entry at the Heikin Ashi open price introduce a form of backtesting bias.
The equity curve looks beautiful.
Live results do not match.
This is the single most common reason Heikin Ashi strategies fail the transition from historical data to a live account.
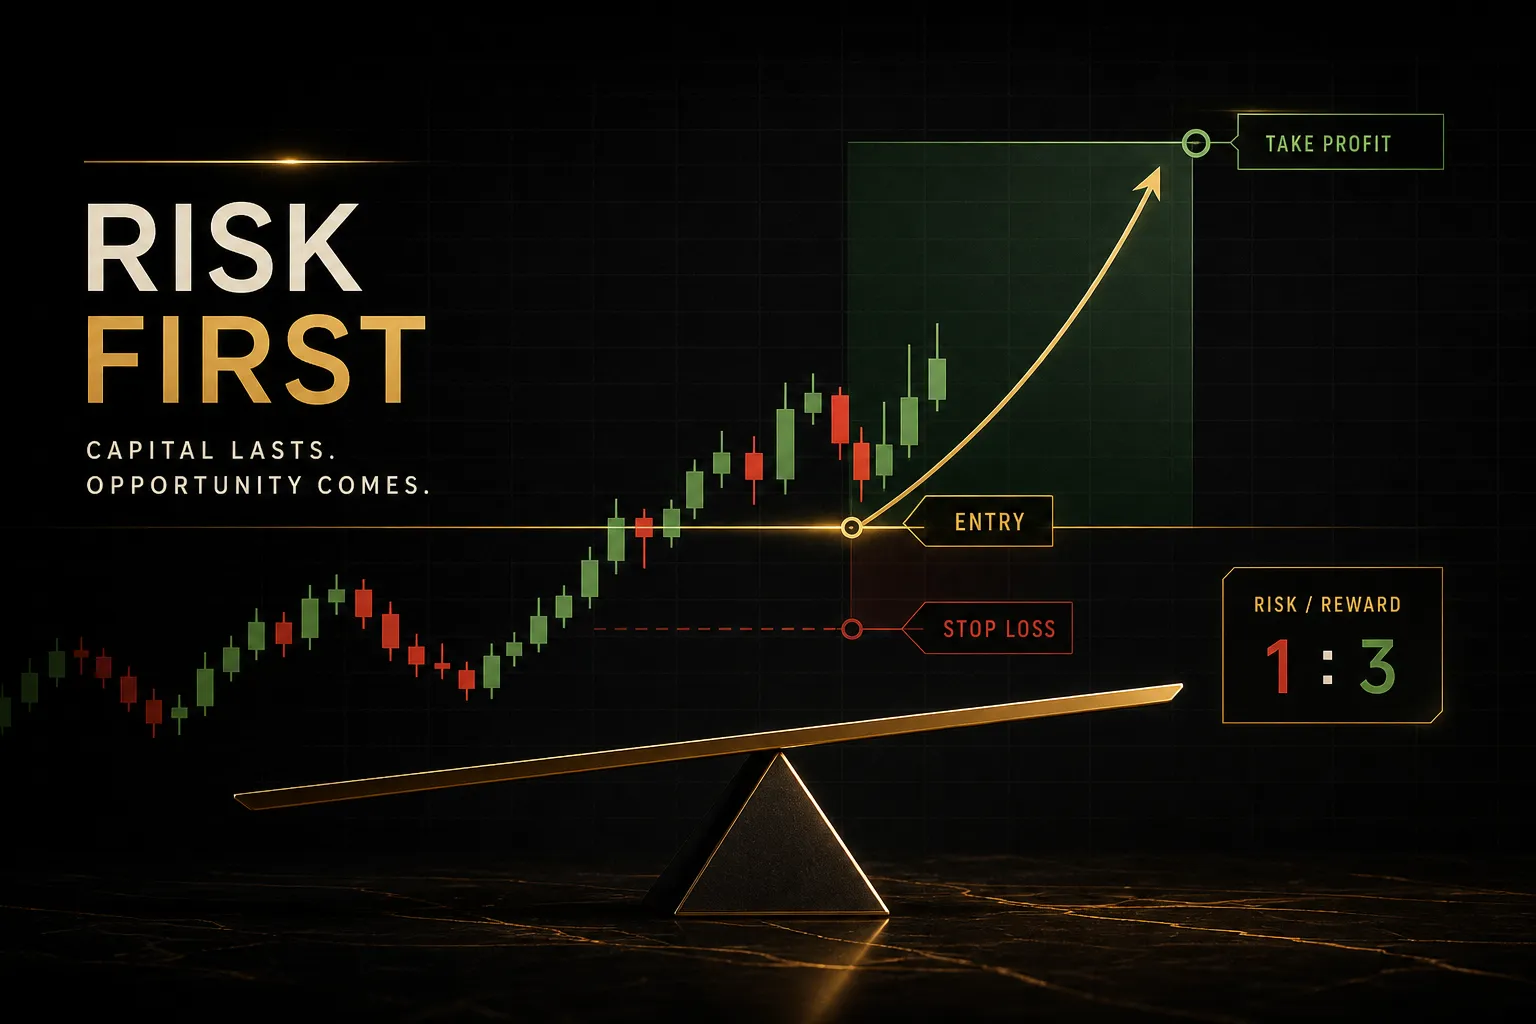
Placing Stops With Real Swings
The fix is straightforward: read direction on the Heikin Ashi chart, then switch to standard candles to define every price level.
Anchor stop-loss placement to real market structure.
That means actual swing highs and swing lows, genuine support and resistance levels where price has reacted more than once, or a volatility buffer such as 1.5 times the Average True Range measured from a real price chart. All three are defensible because they correspond to levels the market has actually respected.
Take-profit levels follow the same rule. A prior swing high, a session high, a measured move from a real range: these are places where order flow genuinely clusters.
Some trading tools build this separation into their design rather than leaving it to trader discipline. PipTrend, for example, splits the two functions deliberately: a colour-coded trend signal communicates direction only, while entry, stop, and target guidance comes from marked real-price levels such as session highs and lows, VWAP, and supply and demand zones.
The trend layer tells you which way to lean. The price layer tells you where to act.
That architecture mirrors exactly what this section recommends, and it removes the temptation to trade off a synthetic number because it happened to be the one on screen.
Building a Complete Workflow
A chart type is not a strategy.
What turns Heikin Ashi into something usable is the process wrapped around it, and that process has four steps that never change order.
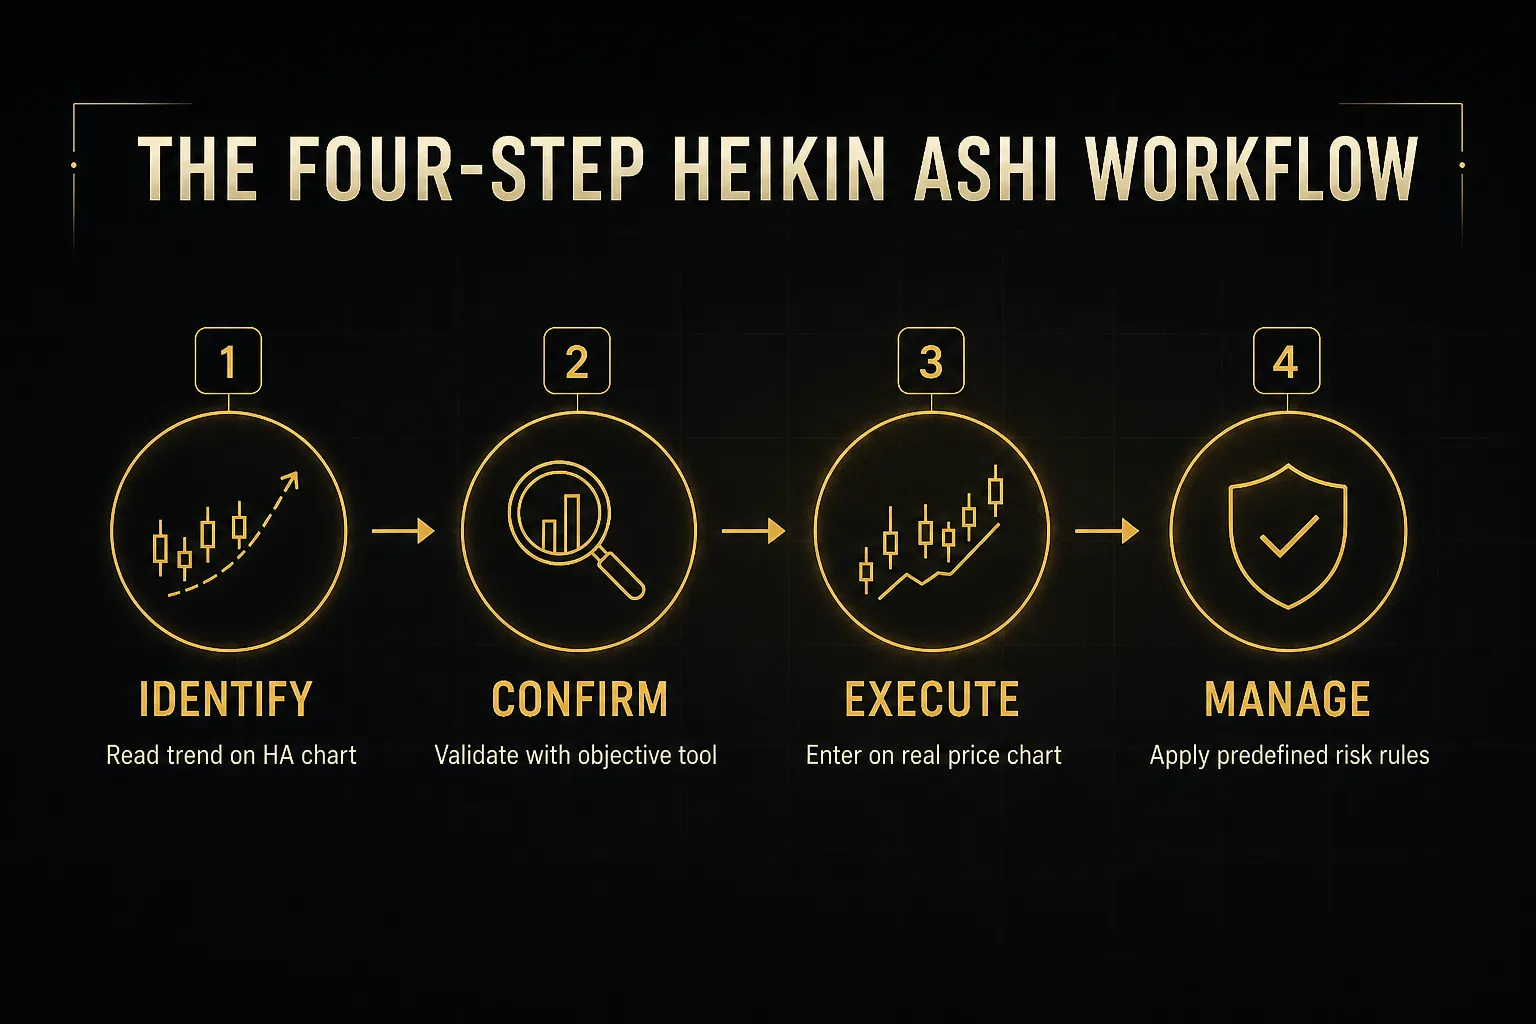
Step one is directional.
Load a Heikin Ashi chart on your higher timeframe and answer one question: up, down, or neither. Step two demands independent confirmation from a tool that does not simply repeat what the candles already told you.
Step three switches the chart back to standard candles for the actual entry, stop, and target. Step four applies rules you wrote before the trade existed, covering position size, stop distance, and the conditions under which you exit early.
Skip step three and you are back in the synthetic price trap. Skip step four and no chart type will save you.
Multi-Timeframe Trend Filtering
Multi-timeframe analysis is where Heikin Ashi does its best work. Use a Daily or H4 Heikin Ashi chart purely as a directional filter, then drop to a lower timeframe with standard candles to execute.
The logic is clean.
Higher timeframes have fewer bars, so the smoothing produces a stable read that changes maybe once every several weeks in a trending market. Lower timeframes give you the granularity to place a stop behind a real swing that is twenty pips away instead of two hundred.
A practical pairing: Daily Heikin Ashi for bias, H1 standard candles for entry. Or H4 Heikin Ashi for bias, M15 standard candles for entry.
The ratio of roughly four to six times between timeframes keeps the two views related without making the lower chart irrelevant.
What you must not do is run Heikin Ashi on both. Smoothed data feeding smoothed decisions compounds the lag, and by the time both timeframes agree, the move is often finished.
Indicators Worth Pairing
Two confirmation tools.
That is the ceiling, and going beyond it produces the illusion of confluence rather than the substance of it.
Pair Heikin Ashi with one trend-strength tool and one momentum tool. For trend strength, a 50 or 200 period moving average gives you a positional reference, or ADX gives you a numeric measure where readings above 25 typically indicate a trend worth following and readings below 20 indicate the range conditions where Heikin Ashi signals fail most often.
For momentum, RSI or MACD works. RSI flags overextension and divergence; MACD tracks the rate of change in the trend itself.
Pick one.
Running both is redundant because they derive from overlapping calculations of the same price series.
The combinations to avoid are the ones that repeat information. Heikin Ashi plus a smoothed moving average plus a MACD signal line is three versions of the same lagging trend read, dressed up as agreement.
If all three turn at the same time, they have not confirmed each other.
They have restated one observation.
Volume, where you have reliable data, adds genuinely independent information. A Heikin Ashi trend supported by rising volume on trend-direction bars is meaningfully stronger than the same pattern on declining participation.
Matching Styles to Timeframes
Heikin Ashi is not equally useful across trading styles, and the difference is significant enough to change whether you should use it at all.
| Trading Style | Typical Timeframe | Heikin Ashi Fit | Recommended Role |
|---|---|---|---|
| Position trading | Weekly / Daily | Excellent | Primary trend chart; lag is irrelevant over months |
| Swing trading | Daily / H4 | Strong | Bias filter plus pullback identification |
| Day trading | H1 / M15 | Moderate | Directional filter only, never an entry trigger |
| Scalping | M5 / M1 | Poor | Lag plus spread costs usually erase the edge |
Swing trading benefits most. Holding periods of several days to a few weeks give the smoothing room to work, and a one to two bar lag on a daily chart costs little relative to the size of the move being captured.
Scalping is the weakest fit by a wide margin. On an M1 chart, Heikin Ashi typically confirms direction one to three bars after the actual turn, and on a market with a two pip spread targeting eight pip moves, that delay consumes a meaningful share of the expected profit before the trade begins.
Which raises the question everyone eventually asks: does Heikin Ashi repaint?
No, historical Heikin Ashi bars do not repaint. Once a bar closes, its values are fixed permanently.
But the live, forming bar updates continuously as the current price changes, exactly like a standard candle does, and its final colour is not known until the bar closes.
The lag is real and structural.
Because each HA Open depends on the prior HA Open and Close, the calculation carries yesterday’s information into today by design. That is the smoothing mechanism working as intended.
It also means the chart will always confirm a turn after the turn has happened, never before.
Anyone selling a Heikin Ashi system on the promise of early entries is selling something the mathematics cannot deliver.
Common Heikin Ashi Questions
Is Heikin Ashi good for beginners?
Yes, Heikin Ashi is genuinely useful for beginners learning to read trend direction, because it removes most of the visual noise that makes standard charts confusing. Seeing a clean sequence of green candles teaches trend recognition faster than squinting at a choppy candlestick chart.
The caveat matters just as much.
Beginners should keep a standard price chart open alongside it and place every order, stop, and target from that chart.
Learning direction on Heikin Ashi is fine. Learning price levels there builds a habit that costs money later.
What is the best indicator to use with Heikin Ashi?
A trend-strength tool complements Heikin Ashi better than a second momentum oscillator, with ADX and a longer-period moving average being the two strongest choices. ADX quantifies whether a trend is strong enough to follow, filtering out the ranging conditions where Heikin Ashi colour changes are least reliable.
If you want momentum as well, add exactly one, either RSI or MACD, not both. And check whether your platform calculates indicators from Heikin Ashi values rather than real prices, because a smoothed input produces a flattering and slightly misleading oscillator.
Can Heikin Ashi predict the next candle?
No.
Heikin Ashi cannot predict future price action, because every value it produces is derived from data that has already occurred. It smooths and averages the past, and that is the full extent of what the formula does.
What it can do is describe the current condition more clearly than raw price. A sequence of six no-wick green candles tells you buyers have been in control recently.
It says nothing certain about candle seven.
Should I use Heikin Ashi or candlesticks?
Use both, for different purposes: Heikin Ashi for trend context and standard candlesticks for entry, exit, and stop placement. Treating this as an either-or choice is the mistake.
Standard candles preserve the real open, high, low, close, gaps, and single-bar reversal patterns that precise execution depends on. Heikin Ashi discards those details in exchange for clarity.
Keep both charts available and use each for what it is built to do.
How accurate is the Heikin Ashi strategy?
There is no fixed or published win rate for Heikin Ashi, because it is a charting method rather than a strategy with defined entry and exit rules. Any accuracy figure you see quoted is describing one specific rule set tested on one specific market over one specific period.
Performance depends on the market’s trending versus ranging character, the confirmation rules layered on top, and above all on risk management. The same Heikin Ashi signals that perform well in a sustained trend produce repeated whipsaw losses in a range.
The chart type is not the variable that determines the outcome.
Can you trade directly from Heikin Ashi candles?
You should not place live orders directly off Heikin Ashi values, because those values are synthetic averages rather than executable prices. A Heikin Ashi high or low frequently sits at a level the market never traded, so orders keyed to it misrepresent your actual risk.
Use the candles to determine direction, then read your entry, stop, and target from the standard price chart. It costs one extra click and removes an entire category of error.
One Tool, Not the Whole System
Heikin Ashi filters trend noise.
It does not generate trade signals, and it does not display real prices.
Hold those two facts together and the tool becomes genuinely valuable; forget either one and it becomes expensive.
The decision rule is simple.
If your problem is that you cannot tell which way a market is trending, add a Heikin Ashi chart as a secondary view and let it do the filtering. If your problem is precise entries, stops, and targets, keep every one of those decisions on the real price chart where the numbers correspond to something a broker will actually fill.
The traders who get lasting value from Heikin Ashi are not the ones hunting for the perfect colour-change rule. They are the ones who use the clarity it provides, confirm it with something independent, and size every position against real market structure.
That combination is what separates a useful filter from a false promise of accuracy.
Sources
Risk Disclaimer: Trading involves risk. Past performance doesn't guarantee future results. Only trade with money you can afford to lose. PipTrend is a tool to assist your trading decisions, not financial advice.