A Beginner's Guide to Smart Index Trading
On this page
What Is Index Trading, Really?
Most people who say they “invest in the S&P 500” have never bought a single share of the index.
They can’t.
A stock market index is a calculation, not a company.
Index trading means speculating on the price direction of a basket of stocks without owning the underlying shares. When you trade the Nasdaq-100, you are taking a position on a number that reflects the combined, weighted value of 100 companies.
Nothing gets delivered to you.
That distinction matters more than beginners expect, because it changes what you actually own, what you owe, and how fast you can lose money.
Separate trading from investing right now.
Index investing means buying passive exposure through a mutual fund or index ETF and holding it for years, letting compounding and earnings growth do the work. Index trading means taking directional positions held anywhere from three minutes to three weeks, with a defined entry, a defined exit, and a defined point where you admit you were wrong.
Different goals.
Different tools.
Different failure modes.
Four instruments dominate this space, and each one behaves differently under stress.
ETFs give you unleveraged, cash-settled exposure.
Index futures are standardized exchange-traded contracts with a fixed contract multiplier. CFDs let you trade fractional sizes on margin with financing costs attached.
Options add time decay and non-linear payoffs.
Choosing badly here is the most common beginner mistake.
It is also the most expensive one.
This guide runs on a risk-first framework with four pillars: instrument choice, market context, position sizing, and process. Everything else, the indicators, the entries, the chart patterns, sits downstream of those four decisions.
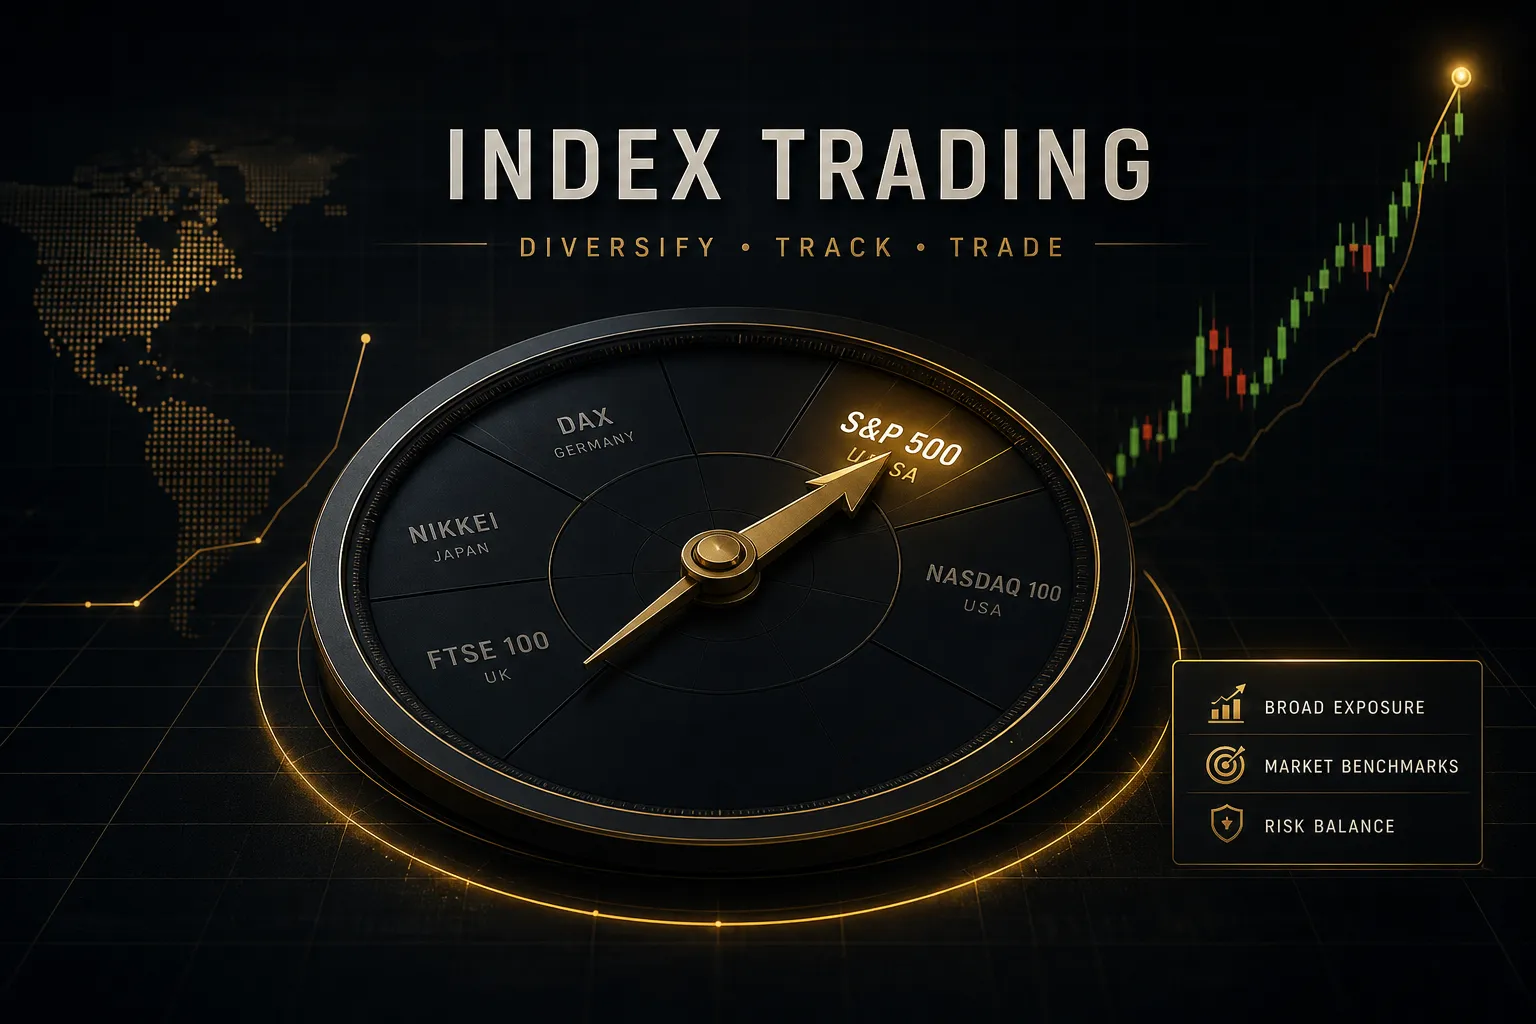
Along the way we will cover the indices that actually carry enough liquidity to trade: the S&P 500, Nasdaq-100, Dow Jones Industrial Average, Germany’s DAX, the UK’s FTSE 100, and the small-cap Russell 2000.
Six markets.
Very different personalities.
The Mechanics Behind Every Index Trade
Two traders can buy “the Nasdaq” on the same morning at the same price and end the month with completely different outcomes.
Not because one read the chart better.
Because one used a leveraged product with overnight financing and the other bought an ETF.
Index Investing vs Index Trading
Index investing targets long-term growth.
You buy a fund that tracks the cash index, reinvest dividends, and accept drawdowns of 30% or more because the holding period is measured in decades. Historically, US equity indices have delivered roughly 7% to 10% annualized returns over long horizons, and the strategy works precisely because you do nothing.
Index trading targets short-term price moves.
You define an entry, a stop loss, and a profit target before you click. Holding period ranges from minutes to weeks, leverage is usually involved, and doing nothing is a decision that costs money through financing charges.
Investing survives volatility by ignoring it. Trading survives volatility by sizing for it.
The practical consequence: an investor who is down 15% is early.
A trader who is down 15% on a single position has already broken their risk rules.
How Weighting Shapes an Index
Indices are not democracies.
How they weight their members determines what actually moves the price.
Market capitalization weighting is used by the S&P 500 and Nasdaq-100. Each company’s influence is proportional to its market value, which is why a handful of mega-cap technology names can drive the majority of a day’s move. As of 2026, the top ten S&P 500 constituents account for roughly a third of the index by weight.
Think about that.
You can be right about 490 companies and still lose.
A price-weighted index like the Dow Jones works differently. Influence is based on share price, not company size, so a $500 stock moves the Dow more than a $40 stock even if the $40 company is ten times larger.
It is a quirk of history, and it makes the Dow behave unlike its peers.
Equal-weighted versions give every constituent the same slice. They tend to be more sensitive to broad market breadth and less sensitive to mega-cap earnings.
Index rebalancing and constituent changes reset those weights on a schedule, typically quarterly. Additions and deletions create predictable order flow around the rebalance date, and spreads often widen as passive funds adjust.
ETFs, Futures, CFDs, and Options
Here is the comparison that should drive your instrument choice.
| Feature | Index ETF | Index Futures | Index CFD | Index Options |
|---|---|---|---|---|
| Ownership | Own fund shares holding real stocks | Contractual obligation, no ownership | Contract with broker, no ownership | Right without obligation, no ownership |
| Margin requirement | None (or ~50% if on stock margin) | Exchange-set; E-mini S&P intraday margin often $500 to $2,000 | Typically 2% to 5% for retail (20:1 to 50:1) | Premium paid in full for buyers; margin for sellers |
| Leverage | 1:1 | Roughly 10:1 to 50:1 depending on margin | Up to 20:1 retail in the EU/UK, higher elsewhere | Non-linear, effectively high on premium |
| Expiration / rollover | None | Quarterly; must roll or close | None on cash indices; expiry on futures-based CFDs | Fixed expiry, weekly to annual |
| Overnight financing | None (expense ratio ~0.03% to 0.20% annually) | Embedded in futures basis, not charged daily | Daily swap charge on notional, roughly benchmark rate plus 2% to 3% | None, but time decay erodes value daily |
| Settlement | Shares delivered to your account | Cash settled at expiry | Cash settled on close | Cash settled (most index options) |
| Realistic loss potential | Limited to amount invested | Can exceed deposit on gaps | Usually capped at balance under negative balance protection; check jurisdiction | Buyers: 100% of premium. Sellers: potentially unlimited |
Notice the pattern.
Every step up in leverage adds a new way to lose money that has nothing to do with being wrong about direction.
One more mechanic beginners consistently misread: leveraged index prices do not match the cash index. An index futures contract trades at a premium or discount to the underlying, and that gap is the futures basis.
The basis reflects the cost of carry.
Interest rates push futures above the cash index, because holding the contract avoids financing a basket of stocks. Expected dividends push futures below it, because futures holders never receive those dividends.
As expiry approaches, the basis converges toward zero. During a quarterly roll, the price on your chart can jump by 20 or 30 points overnight without a single share changing hands.
That is not a market move.
It is arithmetic.
Picking an Index and Reading Its Behavior
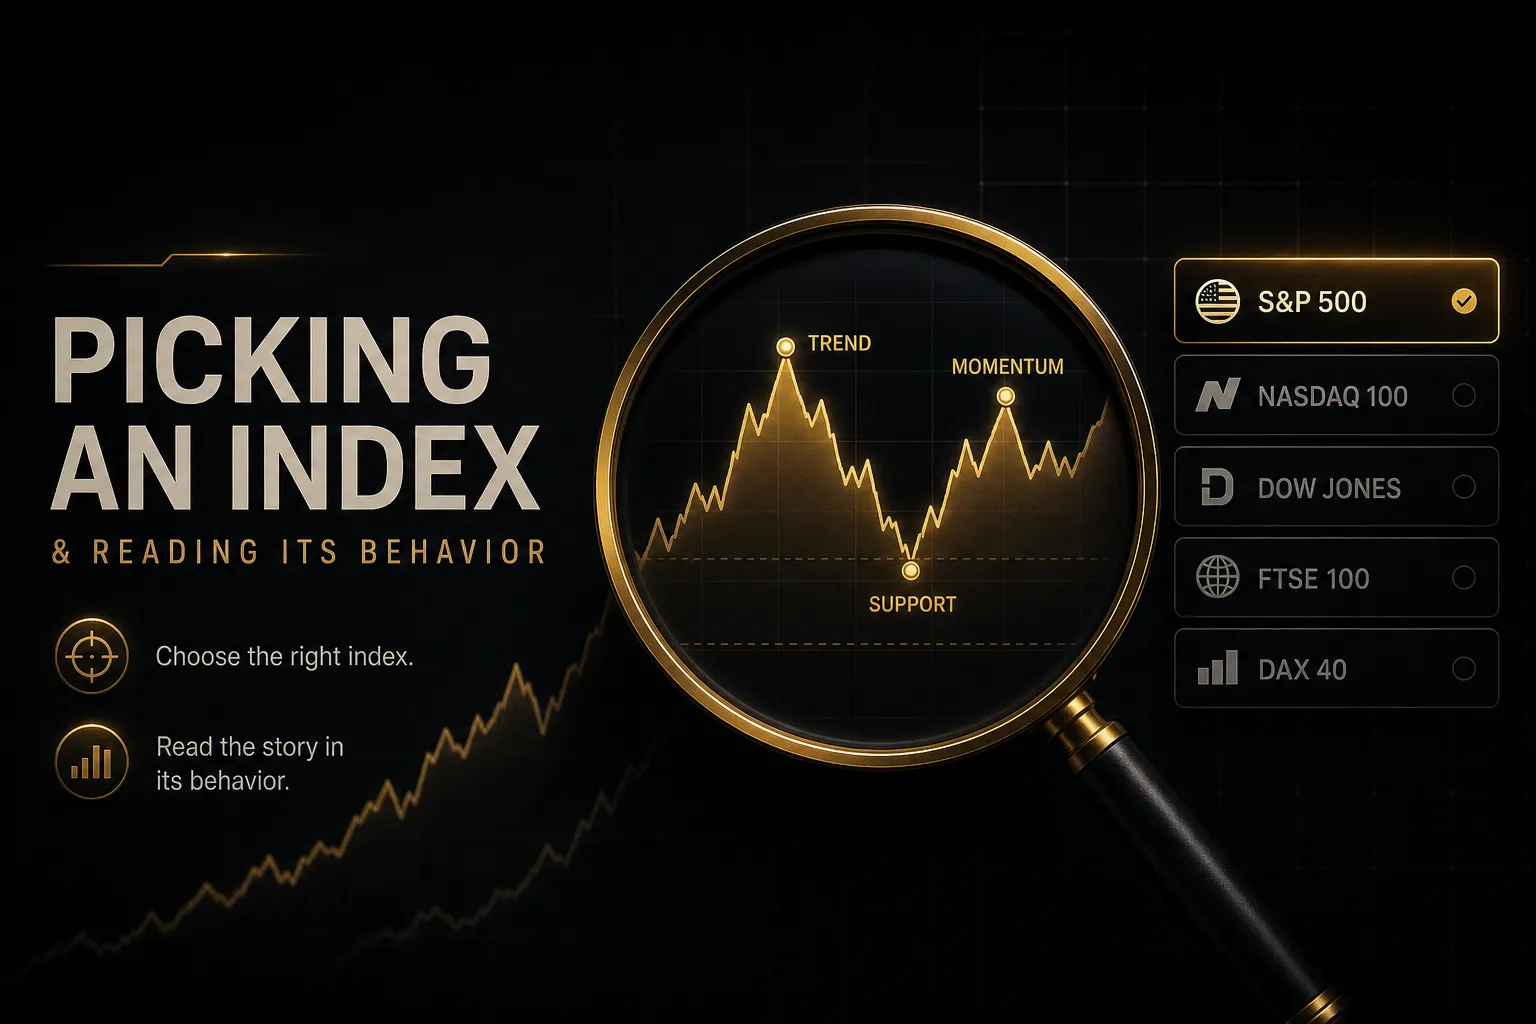
Beginners usually pick an index based on which name they recognize.
Better approach: pick based on when you can actually sit at the screen and how much market volatility your account can absorb.
Liquidity, Volatility, and Session Hours
Each major index has a distinct rhythm, a distinct volatility profile, and a distinct set of hours when spreads are tight enough to trade profitably.
- S&P 500 (US500/ES): The deepest equity index market on earth, with E-mini futures trading billions in daily notional. Typical daily range runs about 0.7% to 1.2% in calm regimes. Best liquidity from the 9:30am ET cash open through roughly 11:30am, then again in the final hour.
- Nasdaq-100 (US100/NQ): Roughly 1.3 to 1.6 times more volatile than the S&P 500 on an average day, driven by concentrated technology weighting. Excellent liquidity in US hours, and it moves hard on mega-cap earnings and rate headlines.
- Dow Jones (US30/YM): Price-weighted and heavily influenced by a few high-priced constituents. Point moves look dramatic because the index sits above 40,000, but percentage moves are usually smaller than the Nasdaq’s.
- DAX 40 (GER40): Germany’s benchmark, most active from the 9:00am CET open through the London/New York overlap. Sensitive to European rate policy, energy prices, and industrial and export data.
- FTSE 100 (UK100): Dominated by energy, mining, and financials, with heavy overseas revenue exposure. This makes it unusually sensitive to sterling and commodity prices rather than the UK domestic economy.
- Russell 2000 (US2000): Small-cap focused and the most sensitive to credit conditions and domestic rate expectations. Wider spreads and thinner books than the large-cap indices, which punishes sloppy entries.
Scheduled events widen spreads everywhere.
US CPI, non-farm payrolls, FOMC decisions, ECB announcements, and the first week of earnings season all produce slippage that can double or triple your intended stop loss.
Check the economic calendar before you place a single order.
Correlation Between Major Indices
Trading the S&P 500, Nasdaq-100, and Dow Jones simultaneously is not diversification.
It is the same bet placed three times with three separate commission charges.
- Constituent overlap is severe. Every Nasdaq-100 mega-cap that matters also sits near the top of the S&P 500. Apple, Microsoft, and Nvidia alone can drive both indices in the same direction on the same headline.
- Correlations spike exactly when it hurts. Daily correlation between US indices typically sits between 0.85 and 0.95, and in a risk-off session it approaches 1.0. Your “three positions” become one oversized position at the worst possible moment.
- European indices are correlated but not identical. The DAX and FTSE follow US direction most days, yet diverge on local policy, currency moves, and sector shocks. That divergence is tradeable, but only if you understand what drives each one.
- Real diversification needs different drivers. If you want a second market, look at something with a genuinely different risk factor, not another large-cap US equity index.
What actually moves the S&P 500 and Nasdaq-100? Four things, in rough order of impact: mega-cap earnings and guidance, interest rate expectations, dollar strength, and broad risk sentiment.
Learn to read those four and most price action stops feeling random.
Timing matters as much as direction.
The first 90 minutes after a major exchange open and the London/New York overlap (roughly 8:00am to 11:30am ET) carry the deepest liquidity. Outside those windows, thin order books produce false breakout patterns and whipsaws that stop out technically correct trades before the real move begins.
Risk Management That Actually Protects You
You can be right 60% of the time and still blow up an account.
Position size decides survival, not accuracy.
The Position Sizing Formula
The calculation is simple arithmetic that most beginners skip entirely.
Work through it before every trade.
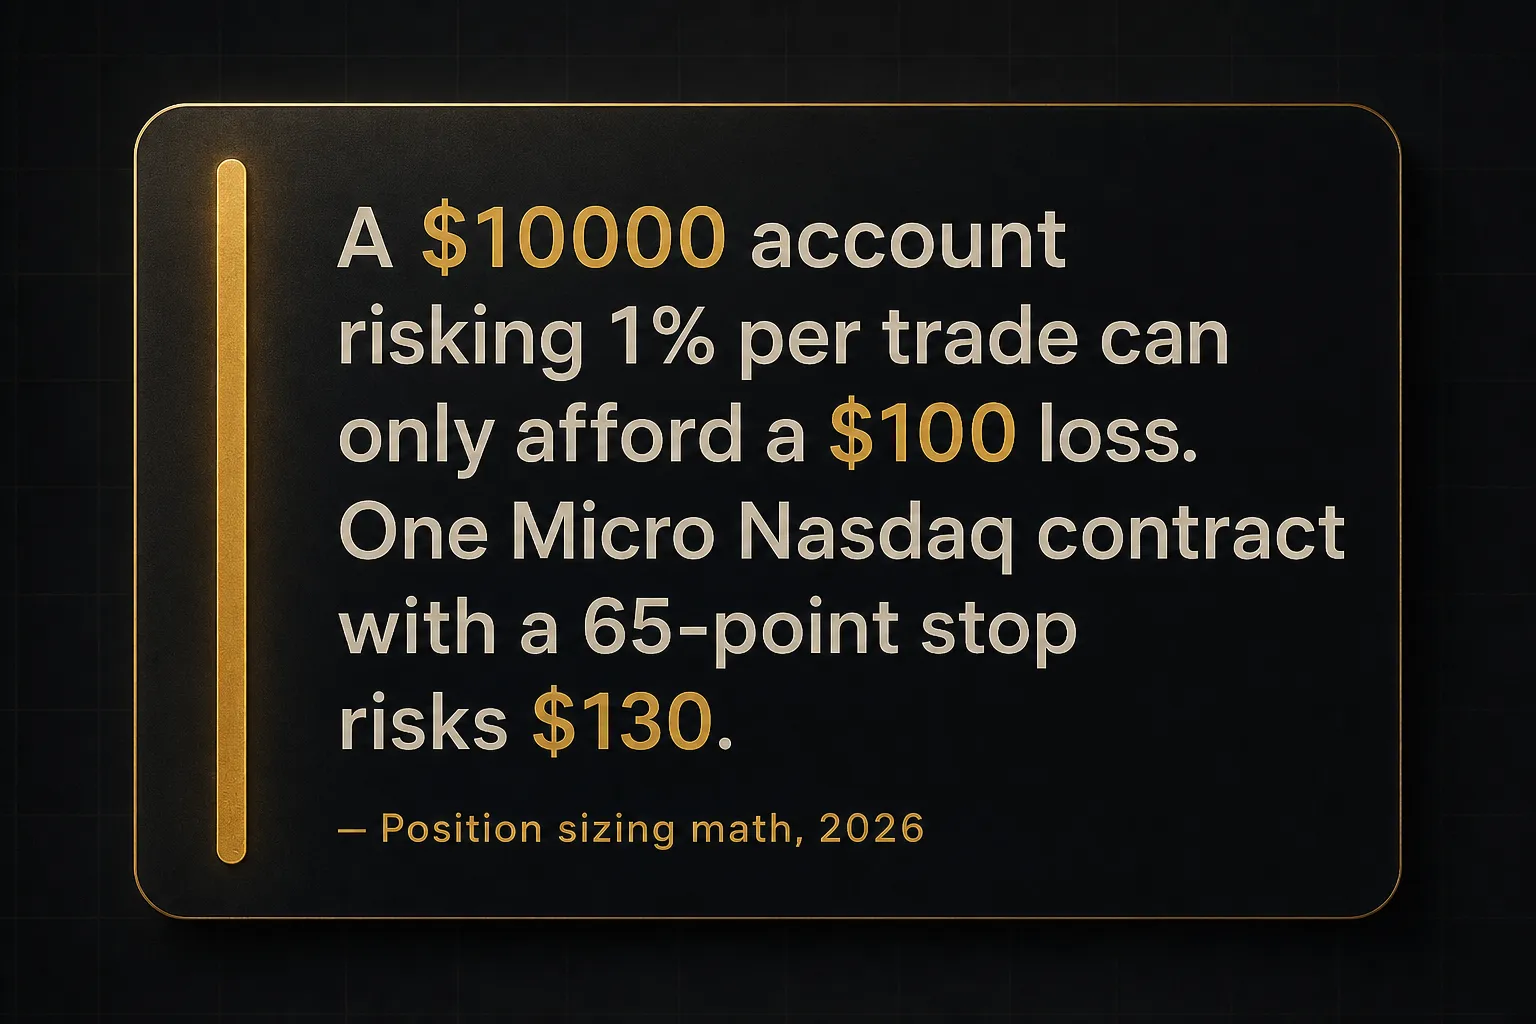
- Define account risk in dollars. Pick a fixed percentage of account equity per trade, typically 0.5% to 1% for beginners. On a $10,000 account at 1%, your maximum loss is $100. That number never changes based on how confident you feel.
- Measure the stop distance in points. Find your structural invalidation level, then measure the gap from entry. Say you are trading NAS100 with entry at 21,400 and a stop at 21,340. That is 60 points.
- Add a spread and slippage buffer. Typical NAS100 CFD spreads run 1 to 3 points in liquid hours, and slippage on a stop during news can add 5 to 15 more. Budget 65 to 70 points of effective risk instead of 60.
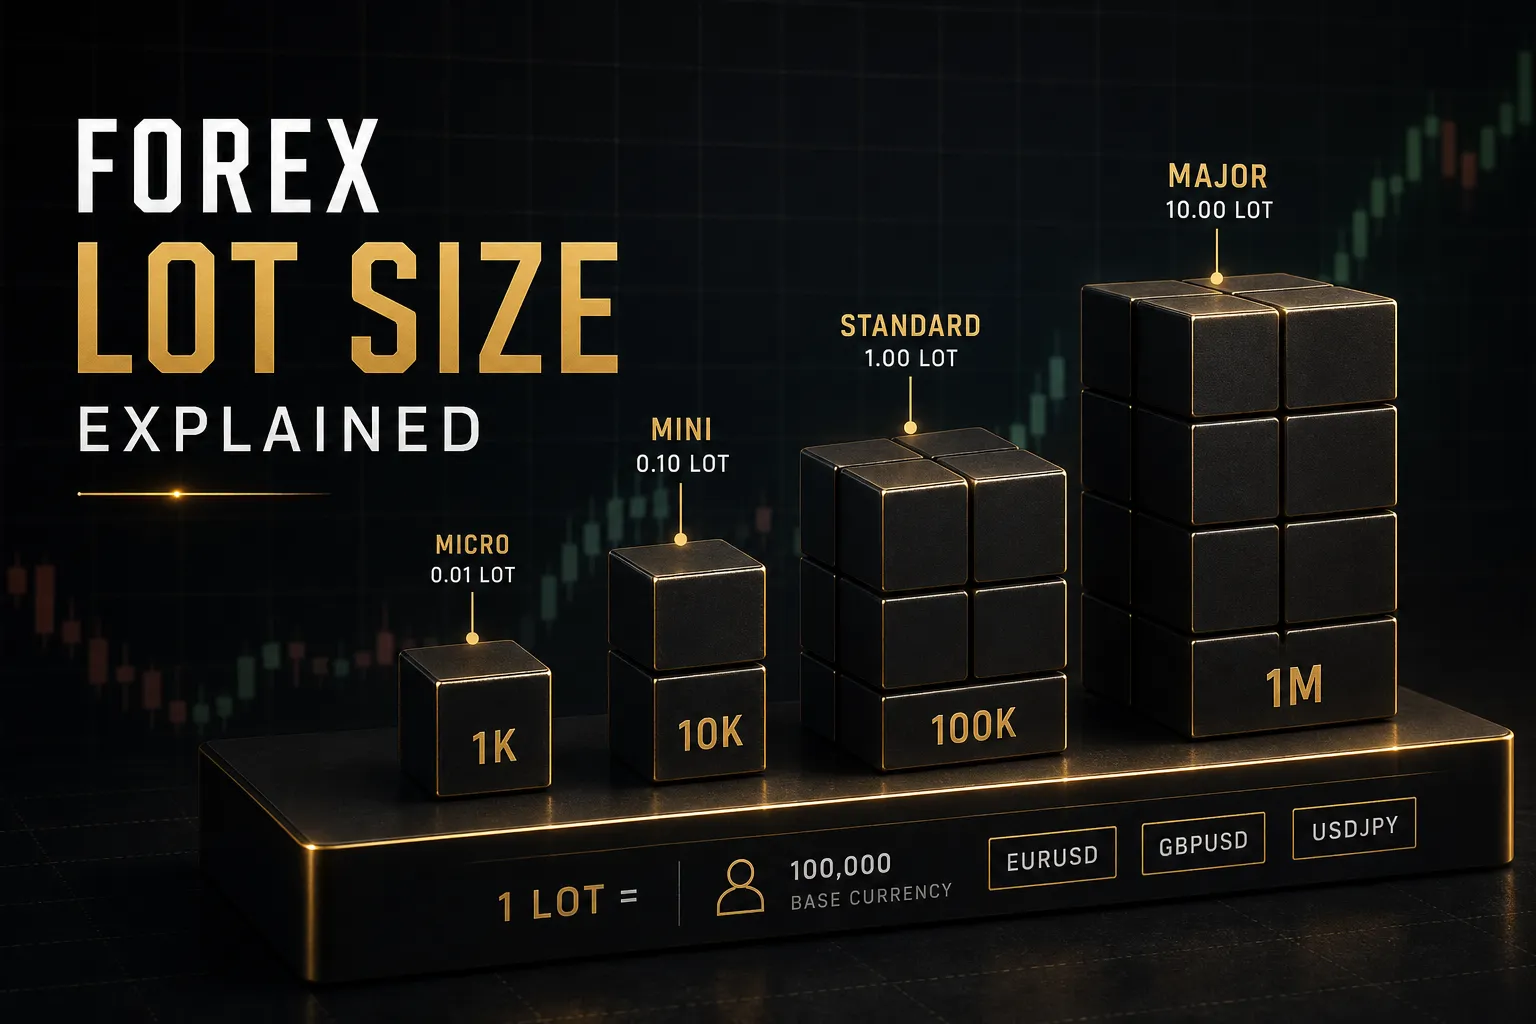
- Identify the point value or contract multiplier. On a standard NAS100 CFD, one lot typically means $1 per point per unit. On a Micro E-mini Nasdaq future (MNQ), the contract multiplier is $2 per point, and on the full E-mini (NQ) it is $20 per point.
- Divide to get position size. Position size = account risk ÷ (stop distance × point value). Using $100 risk, a 65-point effective stop, and $1 per point: $100 ÷ 65 = 1.53 units, so you round down to 1.5. Round down. Always.
- Sanity-check against the futures alternative. One MNQ contract at $2 per point with a 65-point stop risks $130, which already exceeds the $100 limit. That single check tells you the trade is too big for the account, before you place it.
Where to Place Stops
A stop placed at “50 points because that feels right” is not a stop.
It is a donation with extra steps.
- Anchor stops to market structure. Place them beyond the swing high or low that would invalidate your idea, such as the prior session low, the opening range boundary, or a tested support and resistance level. If price trades through that level, your reason for the trade is gone.
- Use ATR to size the buffer. The average true range tells you what normal movement looks like on your timeframe. A stop set at 1.0 to 1.5 times the 14-period ATR beyond structure gives price room to breathe without wandering into noise.
- Widen for volatility regimes, then shrink size. When ATR expands after a CPI print, do not keep the same stop and hope. Widen the stop to match conditions and cut position size proportionally so the dollar risk stays fixed.
- Never move a stop away from price. Trailing toward profit is fine. Widening a losing stop converts a planned $100 loss into an unplanned $400 one, and it is the single most common way disciplined traders become undisciplined ones.
Leverage and Notional Exposure
Here is the trap.
A tight stop feels safe, but the position behind it can be enormous.
- Calculate notional exposure, not just margin. One E-mini S&P 500 contract at 5,800 index points with a $50 multiplier controls $290,000 of notional exposure. The margin requirement to hold it overnight might be $13,000, and intraday margin at some brokers is under $2,000.
- Understand what margin actually is. It is a good-faith deposit, not the maximum you can lose. A 3% adverse gap on that $290,000 position is an $8,700 loss regardless of what you posted.
- Respect gap risk. Index futures trade nearly 24 hours, but liquidity collapses overnight and weekend geopolitical news can open a market well beyond your stop. Stops execute at the next available price, not your requested one.
- Know your liquidation path. When equity falls below maintenance margin, brokers issue a margin call or auto-liquidate, often at the worst moment of the move. Keep free margin well above the minimum, and never treat available leverage as a target.
Leverage magnifies outcomes in both directions.
That is the whole story, and beginners who internalize it early tend to still be trading three years later.
Turning Analysis Into a Repeatable Process
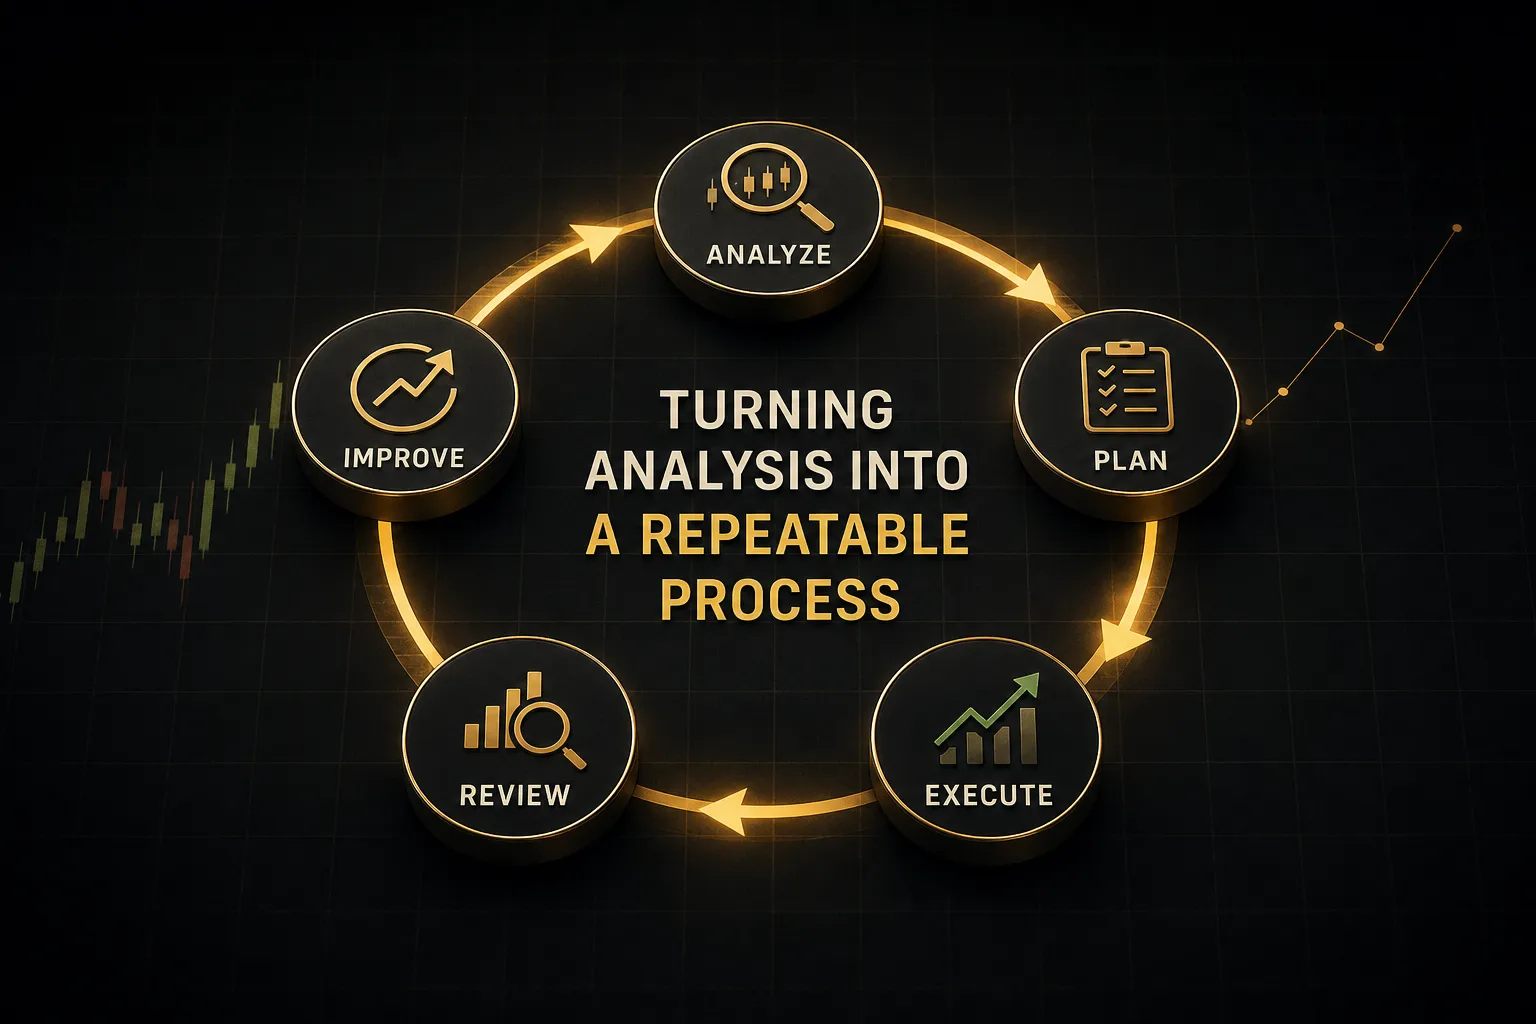
Ask ten struggling traders what went wrong and nine will describe an indicator. Ask them what their process was and you get silence.
Multi-Timeframe Confirmation and Indicators
Every indicator category solves exactly one problem.
Trend detection tells you which direction the market has been favoring. Volatility measurement, usually ATR or Bollinger Band width, tells you how much room price needs.
Momentum tools like RSI or MACD tell you whether the current move has force behind it. Entry confirmation tools such as VWAP or a moving average pullback tell you when to act.
Stacking three momentum oscillators does not triple your confidence. It gives you the same information three times, dressed differently, and it creates the illusion of confirmation.
That illusion is expensive.
Pick one tool per category.
Learn how it behaves in trends, in ranges, and around news.
Then stop adding.
Multi-timeframe analysis is where genuine confirmation comes from.
A dashboard approach, like PipTrend’s 12-timeframe trend table, lets you see at a glance whether the 4-hour, 1-hour, and 15-minute readings agree before you commit capital.
When ten of twelve timeframes lean the same way, you are trading with the current.
When they conflict, you are guessing.
A single signal on a single timeframe is an opinion. Alignment across timeframes is context.
A Pre-Trade Checklist
Before every entry, run the same six checks.
Same order, every time.
- Higher-timeframe bias: What is the daily and 4-hour structure doing? Higher highs and higher lows, or the opposite?
- Session context: Are you in a liquid window, or trading the dead zone between sessions where false breakouts thrive?
- Key levels: Where is the nearest meaningful support and resistance, prior session high or low, and VWAP? Entering directly beneath a major level is how good ideas die.
- Economic calendar risk: Is there a scheduled release in the next 60 minutes that could triple the spread?
- Defined invalidation: What specific price proves the idea wrong, and what is the dollar loss at that price?
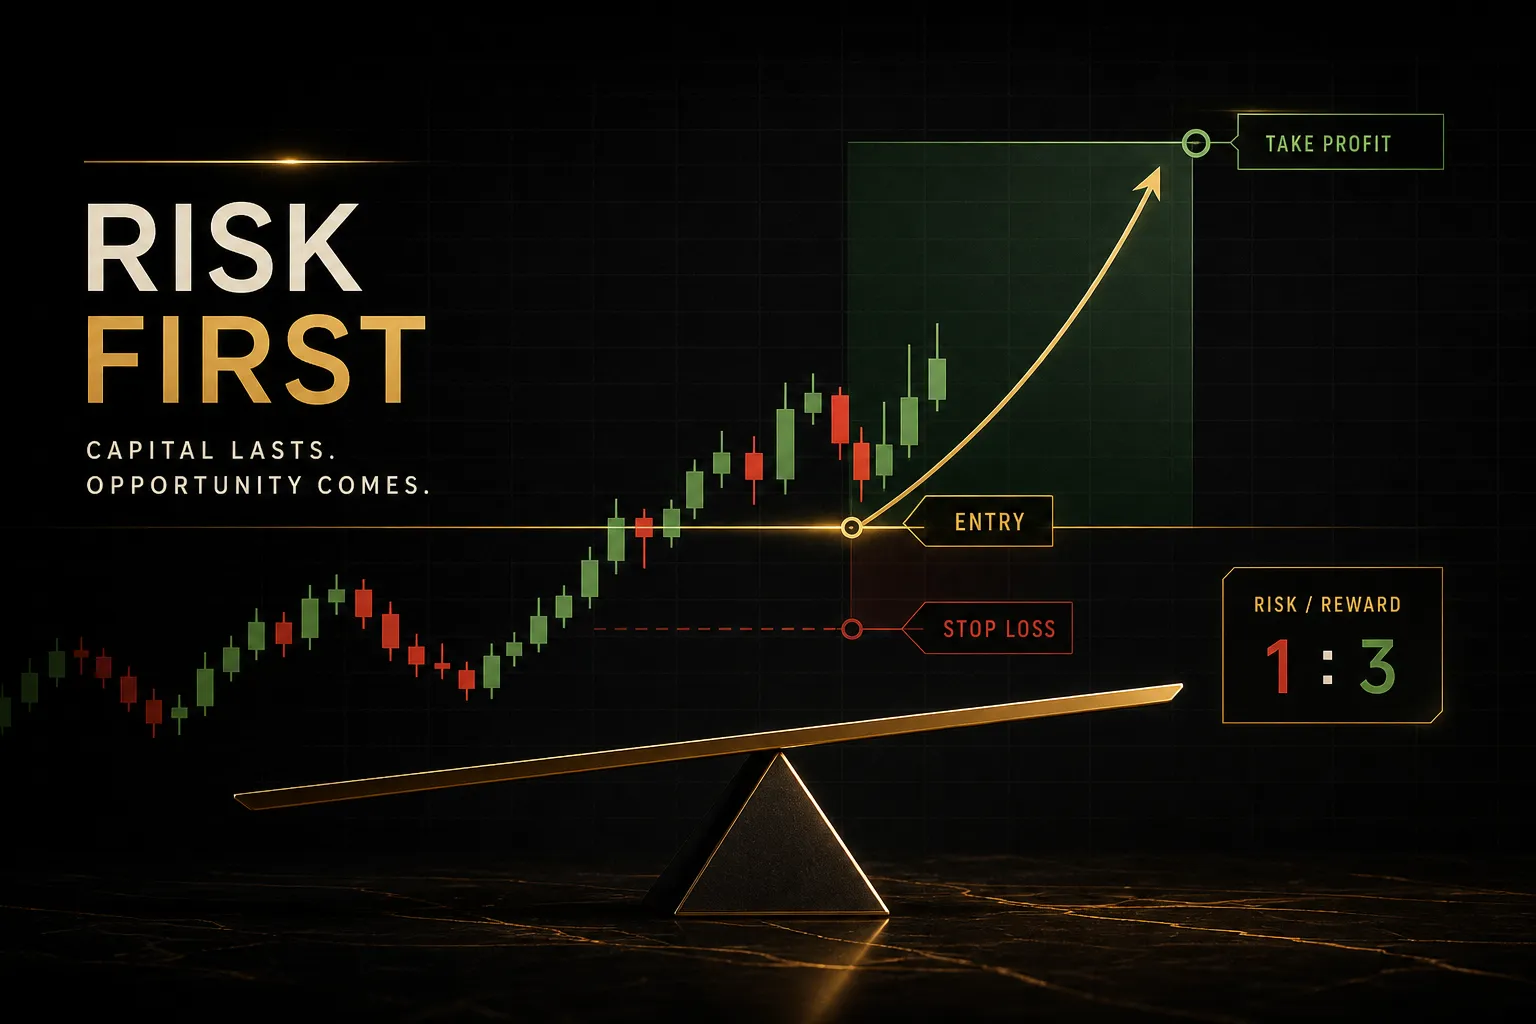
- Minimum risk-to-reward ratio: Does the nearest realistic target offer at least 1.5:1, ideally 2:1? If not, skip it.
One more rule that saves accounts: confirm only after candle close. Intra-candle signals repaint, reverse, and lure you into entries that never technically existed.
Backtesting Pitfalls to Avoid
Backtests lie.
Not deliberately, but reliably, and understanding how is the difference between a strategy and a fantasy.
Look-ahead bias is the most common flaw.
If your rule uses the session high to decide entries during that same session, you are using information you could not have had in real time.
The equity curve looks beautiful and means nothing.
Repainting indicators redraw their history as new data arrives.
A signal that appears on the chart today may not have appeared at the moment the candle formed.
Test only on closed-bar logic.
Survivorship bias matters for index work because constituents change constantly. Backtesting a basket using today’s index members ignores every company that was removed after underperforming, which flatters results substantially.
Then there is execution.
Backtests typically assume a fixed spread and perfect fills. Live markets deliver spread expansion around news, partial fills, and slippage that turns a modeled 2:1 risk-to-reward ratio into a realized 1.4:1.
Add a realistic cost assumption to every backtest: double your average spread, add two points of slippage per trade, and include commissions and overnight financing.
If the strategy still works, you might have something. If it does not… better to learn that on paper.
Paper trading for 30 to 50 trades before going live catches the rest, particularly the execution errors and hesitation that no spreadsheet models.
Index Trading FAQ
Is index trading good for beginners?
Index trading suits beginners better than single-stock trading, because indices are more liquid, less prone to overnight company-specific shocks, and driven by macro factors that are easier to follow.
The risk comes from leverage, not the market itself.
Start with an unleveraged index ETF or a demo account, and only add leverage after you have documented a repeatable process across at least 30 trades.
What is the best index to trade?
The S&P 500 is the best starting index for most traders, thanks to the deepest liquidity, tightest spreads, and the widest range of available instruments from micro futures to ETFs. The Nasdaq-100 offers larger moves but roughly 1.3 to 1.6 times the volatility, which demands smaller position sizes.
Choose based on your available trading hours and your account’s tolerance for daily range, not on which index moved most last week.
How do you make money trading indices?
You profit by taking a directional position and exiting at a better price, going long when you expect the index to rise or short when you expect it to fall. Profit equals the point move multiplied by your point value or contract multiplier, minus spread, commission, and any overnight financing.
Consistency comes from a positive risk-to-reward ratio combined with disciplined position sizing, not from a high win rate.
Can you trade indices with $100?
You can technically open an index CFD position with $100 using micro-lot sizing, but the math rarely works in your favor.
At 1% risk per trade, your maximum loss is $1, and a typical 60-point NAS100 stop would require a position size smaller than most brokers allow. Futures are out of reach entirely, since even micro contract margins usually start around $500 to $2,000.
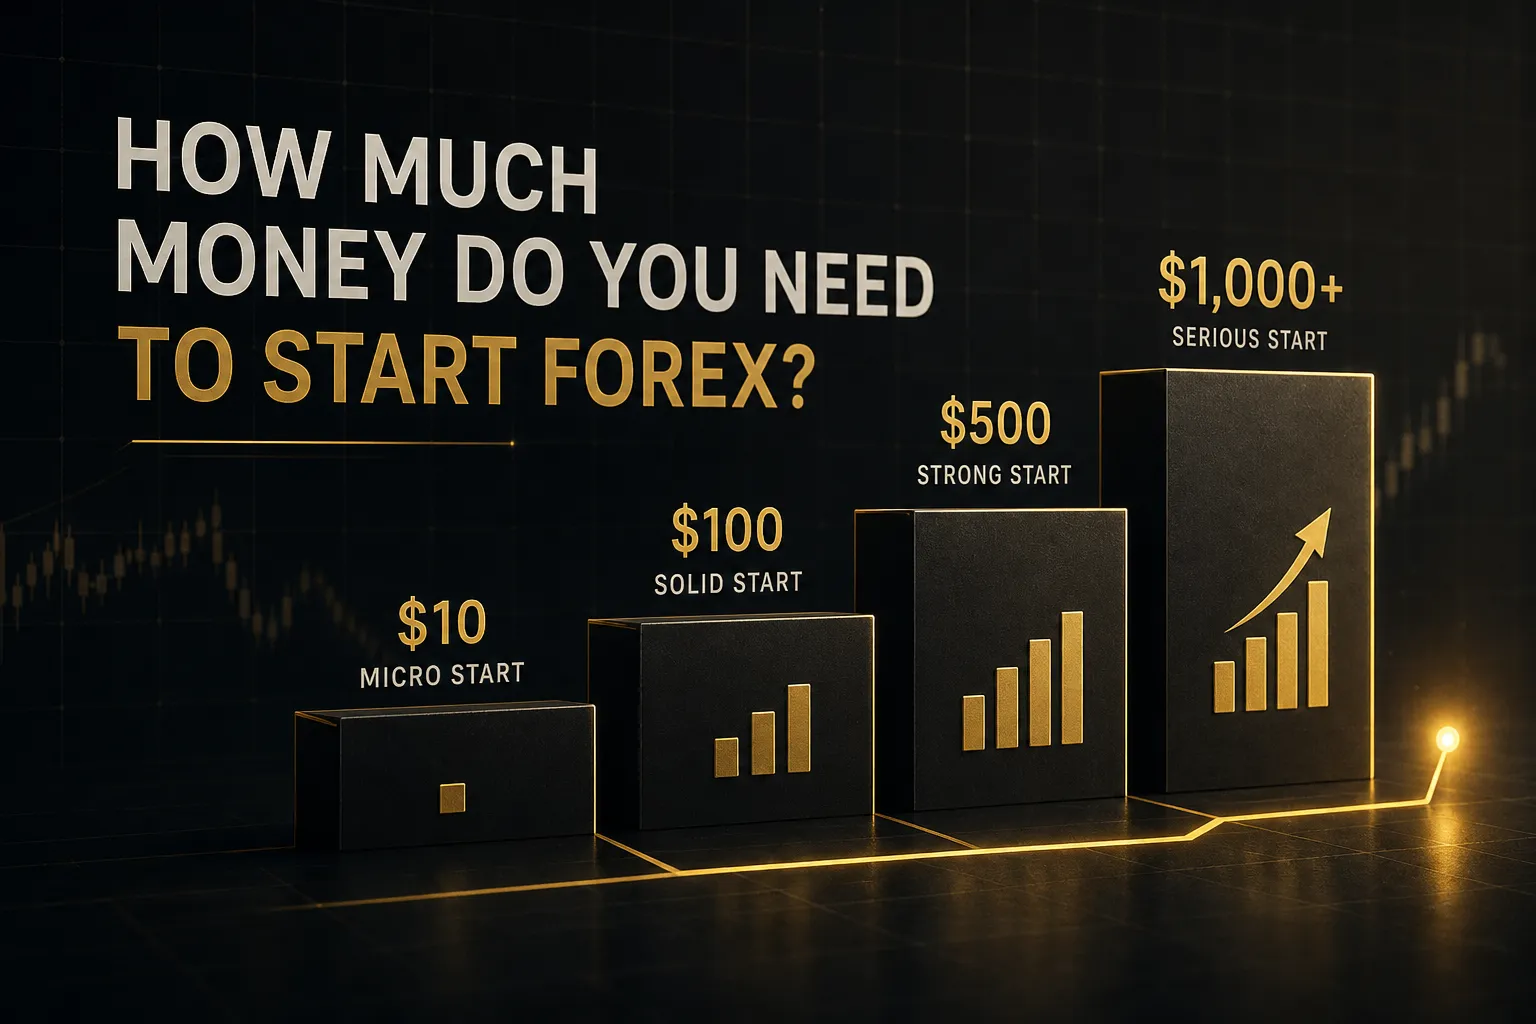
Build the account to at least $1,000 to $2,000 first, or trade a demo while you save.
What is the difference between index trading and forex trading?
Index trading takes a position on a basket of equities driven by earnings, interest rates, and risk sentiment, while forex trades the relative value of two currencies driven by monetary policy and trade flows. Indices have defined cash-session hours with liquidity concentrated around exchange opens, whereas forex runs continuously from Sunday evening to Friday close.
Indices also carry gap risk over weekends and dividend adjustments that currency pairs do not.
What indicators are best for index trading?
The most useful combination covers four distinct jobs: a moving average or trend dashboard for direction, average true range for volatility and stop placement, RSI or MACD for momentum, and VWAP for intraday entry confirmation.
One tool per category is enough.
Adding a second momentum oscillator does not improve accuracy, it just makes conflicting signals easier to ignore.
Trade the Process, Not the Prediction
The decision path is short.
If you are new to markets, start with index ETFs and a paper trading account, and spend your first few months learning how sessions, weightings, and the economic calendar shape price.
No leverage.
No exceptions.
If you are ready for leverage, choose CFDs or micro futures on one liquid index, and only after you have written down your maximum risk per trade in dollars.
One index.
One instrument.
One rule set.
An indicator, a dashboard, or a signal only proposes a direction.
Your position size, your stop, and your invalidation point determine what actually happens to your account.
That is the part you control.
So here is the one action worth taking this week: pick a single index, write down your maximum dollar risk per trade, and log the next 20 trades before you even think about adding a second market.
Twenty trades will teach you more than twenty indicators.
Sources
Risk Disclaimer: Trading involves risk. Past performance doesn't guarantee future results. Only trade with money you can afford to lose. PipTrend is a tool to assist your trading decisions, not financial advice.