
Navigating the unpredictable markets of 2025 demands sharp instincts—especially when it comes to spotting reversals before losses pile up. Learning to identify bearish candle patterns is one of the most powerful skills a trader can develop for anticipating downtrends and safeguarding hard-earned capital.
This article is here to arm you with the must-know knowledge: the top 7 bearish candle patterns every forex, stock, and crypto trader should master this year. We’ll break down each pattern, show why it matters, and help you apply these insights for smarter, more confident trades.
Ready to get ahead of the curve? Let’s dive in and turn market risk into opportunity.
What Are Bearish Candle Patterns?
Understanding bearish candle patterns is a cornerstone of technical analysis—especially in today’s unpredictable markets. These patterns help traders spot potential reversals before a downturn accelerates, providing a crucial edge for protecting capital.
Bearish candle patterns appear on price charts and signal that sellers may be taking control. Their relevance has grown in 2025, as traders across forex, stocks, and crypto seek reliable tools to navigate dramatic swings. Mastering these patterns equips you to anticipate trend changes and manage risk more effectively.
Definition and Role in Technical Analysis
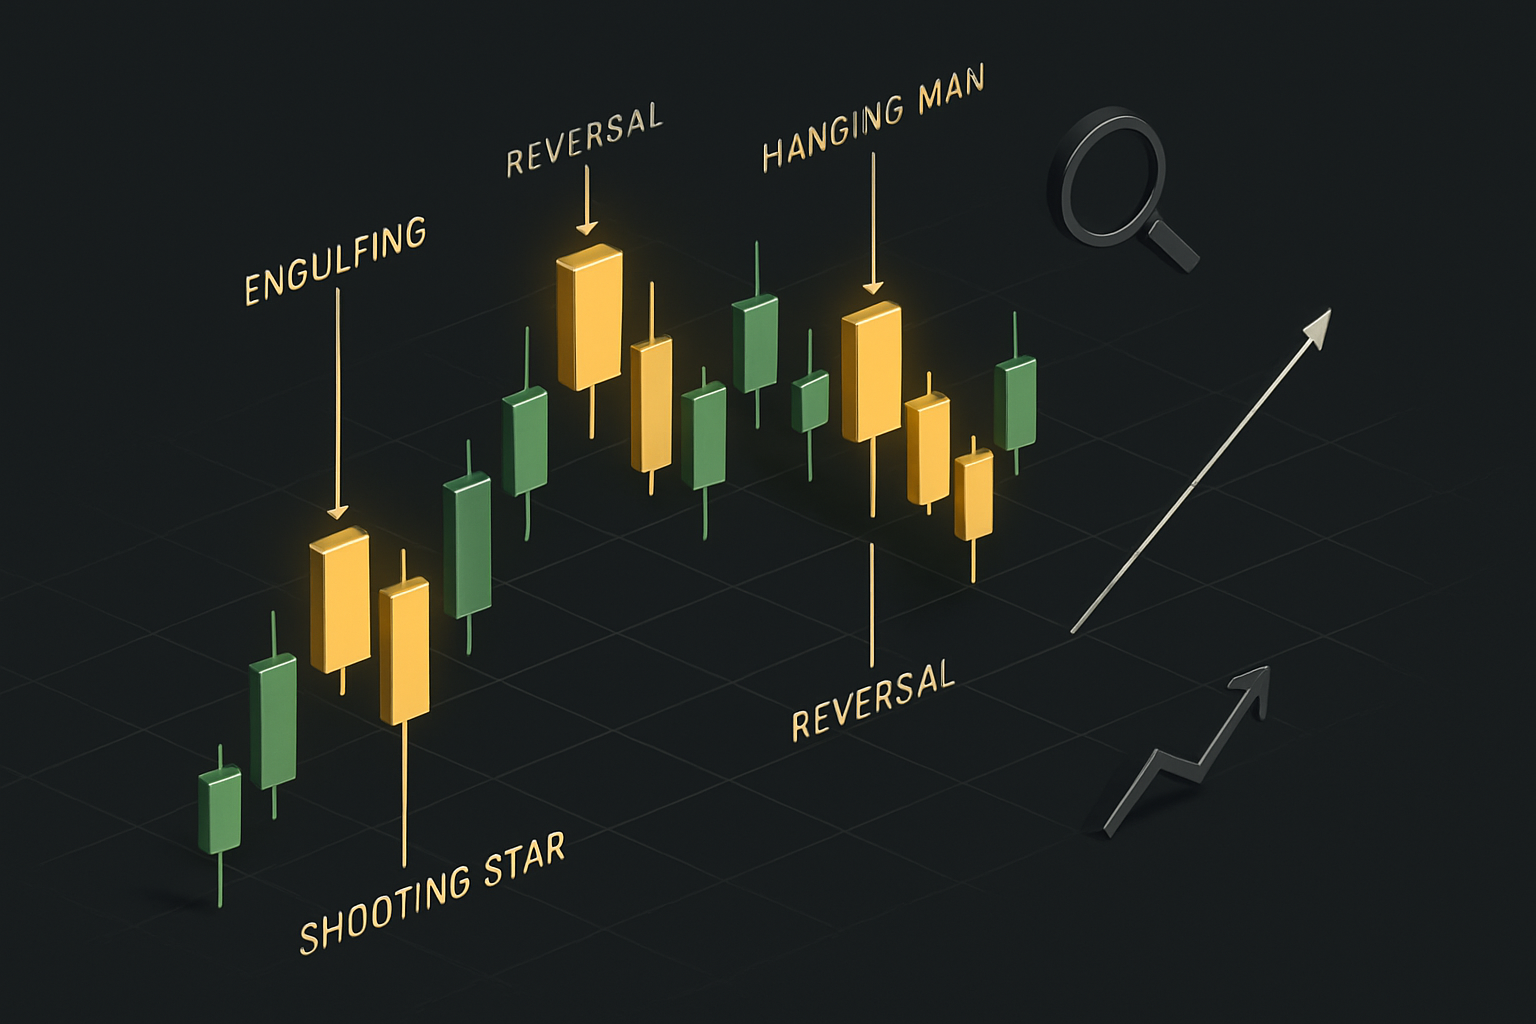
Bearish candle patterns are visual signals on candlestick charts that suggest a possible reversal from an uptrend to a downtrend. Each pattern represents a shift in market sentiment—where buyers’ momentum fades and sellers begin to dominate. Recognizing these signals is essential for anyone aiming to limit losses and maximize profits.
Why do these patterns matter? In volatile periods like 2025, false breakouts and sudden reversals are common. Bearish candle patterns provide early warnings, helping traders exit long positions or prepare for short opportunities. Their popularity has surged, with competitor articles noting that traders increasingly rely on them to navigate uncertainty.
To put these signals in context, let’s compare bullish and bearish candle patterns:
| Aspect | Bullish Candle Patterns | Bearish Candle Patterns |
|---|---|---|
| Trend Signal | Uptrend/reversal upwards | Downtrend/reversal downwards |
| Trader Action | Consider buying/holding | Consider selling/hedging |
| Example Pattern | Hammer, Morning Star | Engulfing, Shooting Star |
Bearish candle patterns are a subset of broader chart patterns. For a deeper dive into how these fit into the overall landscape, check out this overview of Chart Patterns in Trading.
How Bearish Patterns Are Formed
The formation of bearish candle patterns is driven by psychology. When a market is rising, buyers are in control. But as prices reach resistance or overbought levels, selling pressure can build. A bearish candle pattern emerges when sellers overpower buyers, marking a shift in momentum.
Key factors in validating these patterns include:
- Volume: High trading volume adds credibility to the reversal signal.
- Confirmation: Wait for subsequent bearish candles or supporting indicators before acting.
- Timeframe: Bearish candle patterns are most reliable on daily and 4-hour charts but can appear in all timeframes.
For example, a bearish engulfing pattern on a daily crypto chart may signal a significant top, while the same on a 5-minute forex chart might indicate only a brief pullback. In both cases, the psychology is the same: buyers run out of steam, and sellers seize control.
In 2025, traders have noted that these patterns are especially effective in trending markets or near key resistance zones. Always look for volume spikes and confirmation before making a move.
When and Why Traders Use Bearish Patterns
Traders use bearish candle patterns to anticipate and act on potential market reversals. The best conditions for spotting these signals include:
- Extended uptrends approaching resistance
- Overbought technical readings
- High volatility environments
Integrating bearish candle patterns with other tools—such as moving averages, RSI, or MACD—improves accuracy and reduces false signals. Studies have shown that combining confirmation techniques can boost reliability to over 60% in some markets.
Historical examples abound. For instance, the 2024 reversal in major tech stocks was foreshadowed by clusters of bearish candle patterns at multi-year highs. However, no signal is perfect. Traders must remain cautious, as some false signals can occur—especially in choppy, range-bound markets.
By understanding when and why to use bearish candle patterns, you set yourself up for smarter, more disciplined trading in 2025.
Top 7 Bearish Candle Patterns To Know In 2025
Navigating the unpredictable markets of 2025 demands a keen eye for reversal signals. Mastering bearish candle patterns is now more essential than ever for traders in forex, stocks, and crypto. These patterns act as early warning beacons, helping you spot when bullish momentum is fading and sellers are taking control.
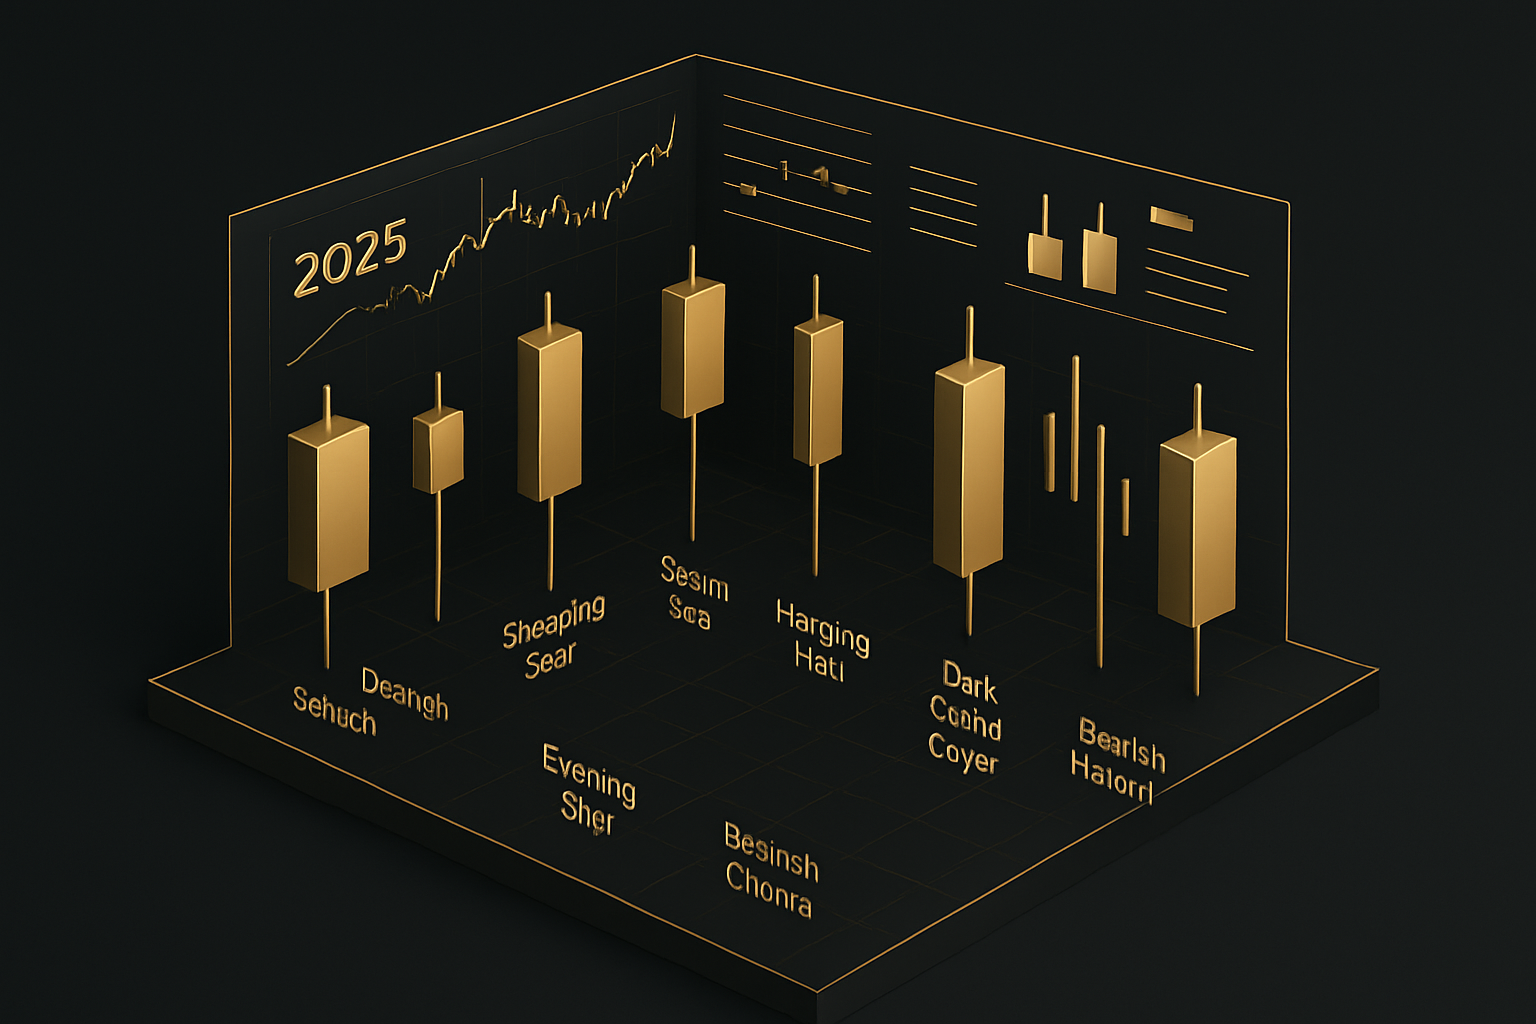
Below, you’ll discover the seven most powerful bearish candle patterns every trader should know this year. Each pattern stands out for its ability to catch reversals—often before the crowd reacts. We’ll break down their structure, trading psychology, and show you how they can fit into your strategy.
To deepen your understanding and see real-world statistics on the effectiveness of these bearish candle patterns, check out the comprehensive resource on trading bearish reversal candlestick patterns.
Whether you’re a day trader or swing trader, learning to read these signals will sharpen your edge and help protect your capital in volatile environments.
1. Bearish Engulfing
The Bearish Engulfing pattern is a classic among bearish candle patterns. It signals a strong potential reversal at market tops and is favored for its reliability across all major asset classes.
Structure-wise, a Bearish Engulfing occurs when a large bearish candle completely “engulfs” the previous smaller bullish candle. This shows a rapid shift from buyer to seller dominance, often marking the peak of an uptrend.
You’ll spot this pattern on daily charts in forex pairs, stocks, and major cryptos—especially after a steady rise. For example, in early 2025, several tech stocks flashed Bearish Engulfing patterns before sharp corrections.
Key confirmation tips include:
- Look for increased volume on the engulfing candle.
- Wait for a lower close on the next candle before entering.
- Avoid jumping in if the pattern forms in a sideways or weak trend.
A common mistake is mistaking minor engulfings for the real deal—size and context matter. Competitor research shows Bearish Engulfing has one of the highest reversal success rates, especially when combined with other indicators. Historically, this pattern’s reliability has made it a favorite among traders seeking early exit signals.
2. Shooting Star
The Shooting Star is a single-candle formation that stands out among bearish candle patterns for its unique shape and psychological implications. It features a small real body near the candle’s low and a long upper wick, with little or no lower shadow. This structure tells you buyers pushed prices up, but sellers quickly overwhelmed them by session’s end.
You’ll often see the Shooting Star after an extended uptrend in stocks, forex, or crypto. Its appearance warns that bullish momentum is faltering. For example, Bitcoin’s run in late 2024 ended with a textbook Shooting Star, foreshadowing a multi-week decline.
For confirmation, look for:
- A follow-up bearish candle with strong volume.
- Additional signals from momentum indicators like RSI.
Statistics show the Shooting Star’s reliability increases on higher timeframes and with added confirmation. Don’t confuse it with the Inverted Hammer, which has a similar shape but appears after a downtrend and signals potential bullish reversal. The Shooting Star remains a go-to for traders aiming to catch the first signs of a market top.
3. Evening Star
The Evening Star is a powerful three-candle reversal pattern and a mainstay in the arsenal of bearish candle patterns. It consists of a large bullish candle, followed by a small-bodied indecision candle (like a Doji or spinning top), and ends with a strong bearish candle that closes well into the first candle’s body.
This pattern typically forms at the top of an uptrend and signals that the bulls are losing steam. The gap between the first and second candles, as well as the decisive move lower on the third, are crucial for confirmation.
For instance, the S&P 500 in early 2025 posted an Evening Star after a prolonged rally, marking a swift reversal. Combining this pattern with RSI or a moving average crossover can provide added conviction.
The Evening Star is more frequent in volatile markets, making it especially relevant for 2025. It’s the mirror image of the Morning Star—a bullish reversal. Traders prize the Evening Star for its clarity and strong historical track record in signaling the end of bullish trends.
4. Hanging Man
The Hanging Man is one of the more subtle bearish candle patterns, but it carries significant weight when spotted after an uptrend. It appears as a small real body at the top of the price range with a long lower shadow and little to no upper wick.
This pattern signals that sellers are starting to test the waters, even as buyers initially push prices higher. An example can be seen in major forex pairs in early 2025, where a Hanging Man preceded notable pullbacks.
Confirmation is vital—wait for a bearish candle on the next session before acting. A common mistake is identifying Hanging Men in downtrends, where they lose their bearish implication.
Competitor articles suggest that while the Hanging Man isn’t the most reliable stand-alone pattern, its effectiveness increases when paired with volume spikes or resistance levels. The psychology here? The market’s optimism is cracking, and sellers are quietly gaining ground.
5. Dark Cloud Cover
Dark Cloud Cover is a compelling two-candle formation that stands out among bearish candle patterns for its clarity. The first candle is bullish, followed by a bearish candle that opens above the prior close and then closes below the midpoint of the first candle.
This pattern signals that sellers are forcefully entering the market after bulls have pushed prices higher. For example, in equities during volatile 2025 sessions, Dark Cloud Cover has often marked the start of sharp reversals.
To spot valid Dark Cloud Covers:
- Ensure the second candle closes well below the midpoint of the first.
- Watch for confirmation from support/resistance levels.
False signals can occur if the bearish candle isn’t large enough or forms in a choppy market. Data from competitor sources confirm this pattern’s effectiveness, especially in forex and equities. Traders often use it to time exits or short entries when momentum shifts abruptly.
6. Three Black Crows
Among bearish candle patterns, Three Black Crows is one of the most visually striking and reliable. It consists of three consecutive long bearish candles, each opening within the previous candle’s real body and closing lower, with minimal wicks.
This pattern represents a strong and sustained shift from buyers to sellers. In trending markets of 2024/2025, such as tech stocks or major indices, Three Black Crows have signaled the start of extended downtrends.
Entry strategies include:
- Waiting for a slight retracement after the third candle.
- Placing stop-losses above the first candle’s high.
Pattern reliability is highest on daily or weekly charts. Insights from competitor content warn against overtrading after this pattern—wait for confirmation from trendlines or moving averages to avoid false moves. Three Black Crows remains a staple for those seeking clear, momentum-based reversal signals.
7. Bearish Harami
The Bearish Harami is a gentler but still important entry in the family of bearish candle patterns. It features a large bullish candle followed by a smaller bearish candle that fits entirely within the previous candle’s real body.
While this pattern suggests a slowdown in bullish momentum, it offers a weaker reversal signal compared to the Bearish Engulfing. Still, it’s useful for early warnings, especially in stocks and crypto.
For confirmation:
- Wait for a third bearish candle or additional indicator alignment.
- Compare to the Bullish Harami—its opposite pattern.
Statistical studies show the Bearish Harami is most effective when the market is overbought or near key resistance. Knowing when to trust or ignore this signal comes with experience and context.
How to Trade Bearish Candle Patterns Effectively in 2025
Trading bearish candle patterns in 2025 isn't just about spotting the right shapes—it's about applying disciplined confirmation and smart risk management. With market volatility at record highs, knowing exactly when and how to act on these signals can make all the difference in your trading outcomes.
Pattern Confirmation and Risk Management
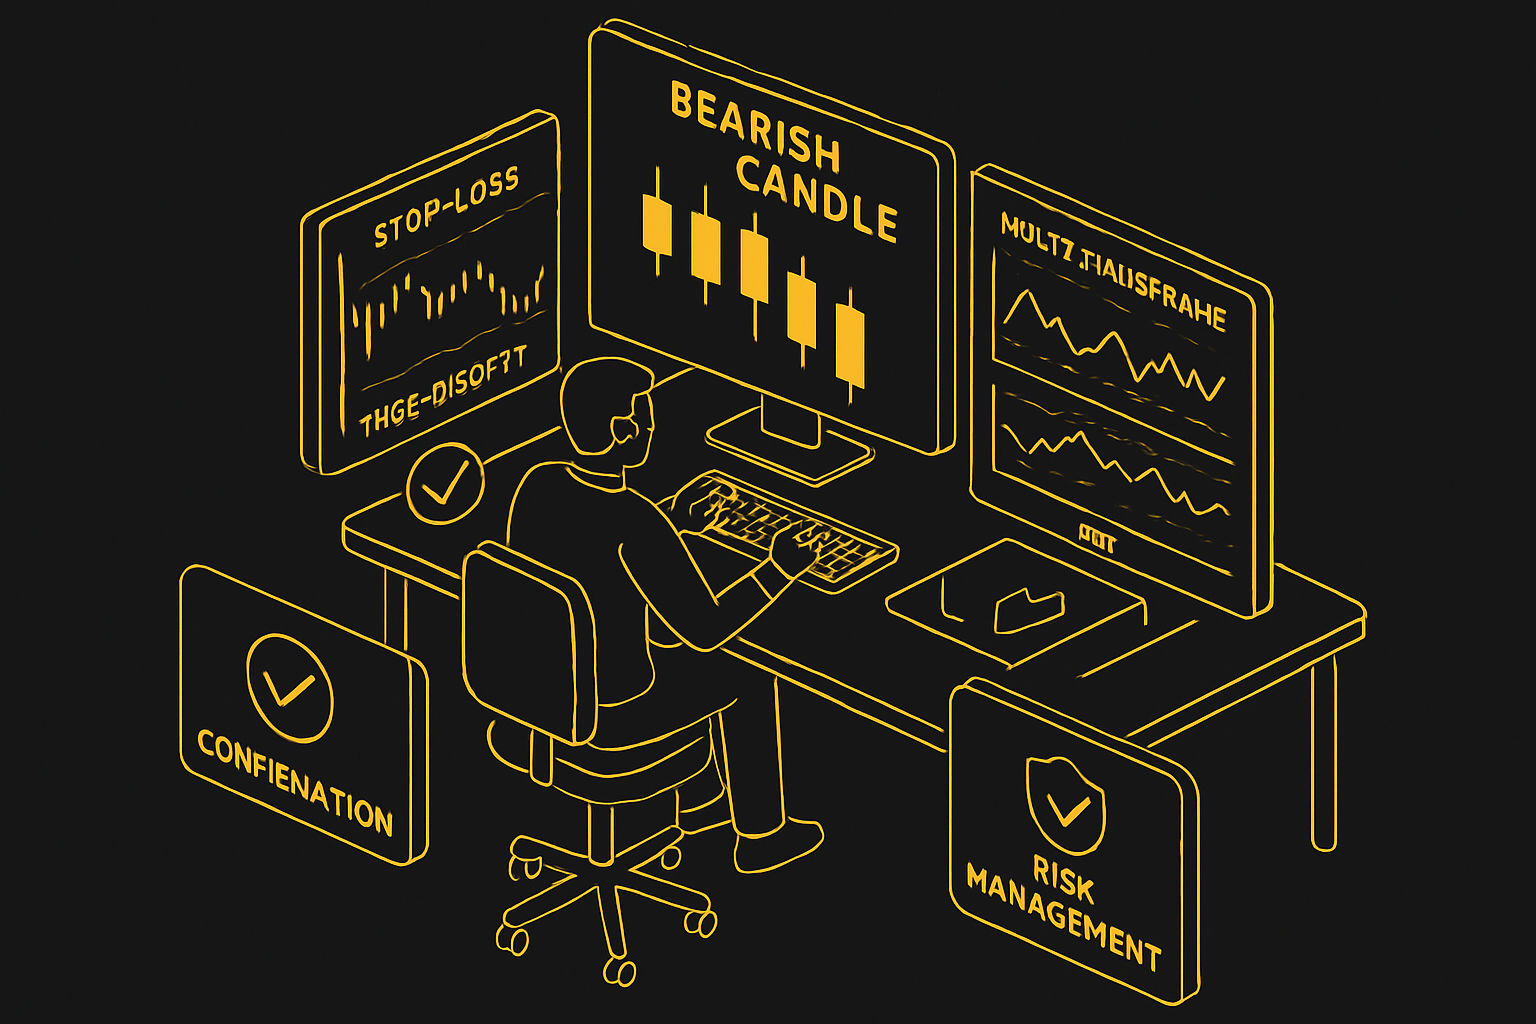
Before acting on bearish candle patterns, always look for confirmation. This could be a follow-up bearish candle, a spike in trading volume, or an additional technical signal. For example, if you spot a bearish engulfing pattern, wait for the next candle to close lower or for volume to increase before entering a trade.
Setting stop-losses and take-profits is crucial. Place your stop-loss just above the high of the pattern, adjusting for recent volatility. Your take-profit should reflect the size of the pattern and your risk/reward ratio—ideally aiming for at least a 2:1 return. Adjust your position size based on the strength of the bearish candle patterns and the market environment.
Consider integrating tools like the RSI indicator to confirm overbought conditions before committing capital. Historical data shows that confirmed bearish candle patterns outperform random entries, offering more consistent results. However, false signals do occur, especially during sideways markets, so always manage your risk accordingly.
Journaling both successful and failed trades helps you refine your approach over time. Data from competitor articles suggest that traders who systematically use confirmation and risk controls see improved win rates and reduced drawdowns.
Combining Patterns with Other Technical Tools
To boost accuracy, combine bearish candle patterns with other technical analysis tools. Moving averages can help filter trades—only taking bearish signals when price is below a key average. The MACD indicator can add another layer of confidence, especially when it shows bearish momentum aligning with your candle pattern.
Multi-timeframe analysis is a powerful way to validate signals. By checking if bearish candle patterns appear on both your primary trading chart and a higher timeframe, you increase the odds of catching genuine reversals. For more on this approach, check out these multi-timeframe analysis tips.
Overlaying trendlines or horizontal support and resistance zones can further refine your entries. If a bearish candle pattern forms right at a key resistance level, the trade setup becomes even more compelling. Some traders are also leveraging AI-powered pattern recognition tools to filter noise and identify high-probability setups.
Ultimately, integrating these technical tools with bearish candle patterns creates a robust trading framework. This multi-layered approach helps you avoid common traps and capitalize on market shifts with greater confidence.
Advanced Tips for Maximizing Bearish Pattern Success
Stepping beyond the basics of bearish candle patterns is what separates good traders from great ones in 2025’s dynamic markets. To truly master these setups and boost your win rate, it’s essential to understand not just the patterns—but also the deeper context and your own trading process.

Pattern Context and Market Conditions
Success with bearish candle patterns starts with reading the broader market landscape. Are you trading in a strong trend, a sideways range, or at a potential reversal point? Understanding this context can dramatically improve your pattern reliability.
Identifying key support and resistance levels is crucial. Patterns forming at these zones—especially after extended rallies—often signal high-probability turning points. Don’t fall into psychological traps like confirmation bias or FOMO; always wait for a clear signal and proper confirmation.
Backtesting is another powerful tool. Test each bearish candle pattern across different asset classes—stocks, forex, crypto—to spot which setups deliver the best results in specific conditions. For example, some patterns work better on daily charts, while others show higher accuracy on shorter timeframes.
To get a statistical edge, review long-term performance studies. The 40 Years of Candlestick Pattern Success Rates analysis provides valuable data on which bearish candle patterns have stood the test of time, showing win rates and reliability across decades.
Here’s a quick summary:
| Pattern | Best Context | Win Rate* |
|---|---|---|
| Bearish Engulfing | Market tops | 79% |
| Shooting Star | Uptrend exhaustion | 72% |
| Dark Cloud Cover | Resistance zones | 68% |
*Source: Industry studies, see link above.
Maximizing Consistency and Profitability
Consistency with bearish candle patterns comes from a disciplined routine. Start by journaling every trade—record the pattern, market context, confirmation signals, and your emotions. Over time, you’ll spot what works and where you can refine your strategy.
Leverage trading communities and trusted resources to validate your pattern recognition. Discussion forums, webinars, and peer review can help you avoid tunnel vision and adapt to new market developments. Stay vigilant for hybrid or emerging signals—2025’s markets are seeing more AI-powered indicators and “smart” pattern variations. If you’re interested in cutting-edge approaches, research like Using Deep Learning and Candlestick Charts for Stock Prediction offers a glimpse into the future of pattern trading.
Professional traders follow a set routine: scan for patterns only in high-probability zones, wait for confirmation (volume, momentum shifts), and manage risk with pre-set stops. They also monitor their win rates closely, often achieving up to 10–15% higher success by layering in advanced confirmation tools.
In summary, treat bearish candle patterns as one piece of a larger puzzle. Combine technical skill, psychological discipline, and continuous learning for robust, repeatable results.
Now that you know the top bearish candle patterns to watch for in 2025, you’re already one step ahead of the market. But spotting these setups is just the beginning—timing your trades and reacting quickly can make all the difference. That’s where a smart tool like PipTrend comes in. With real-time, AI-powered signals and instant alerts, you can take the guesswork out of your trading and focus on what matters: protecting your capital and catching the best moves. Ready to put your new candlestick knowledge into action? See Your Trading Improve With PipTrend