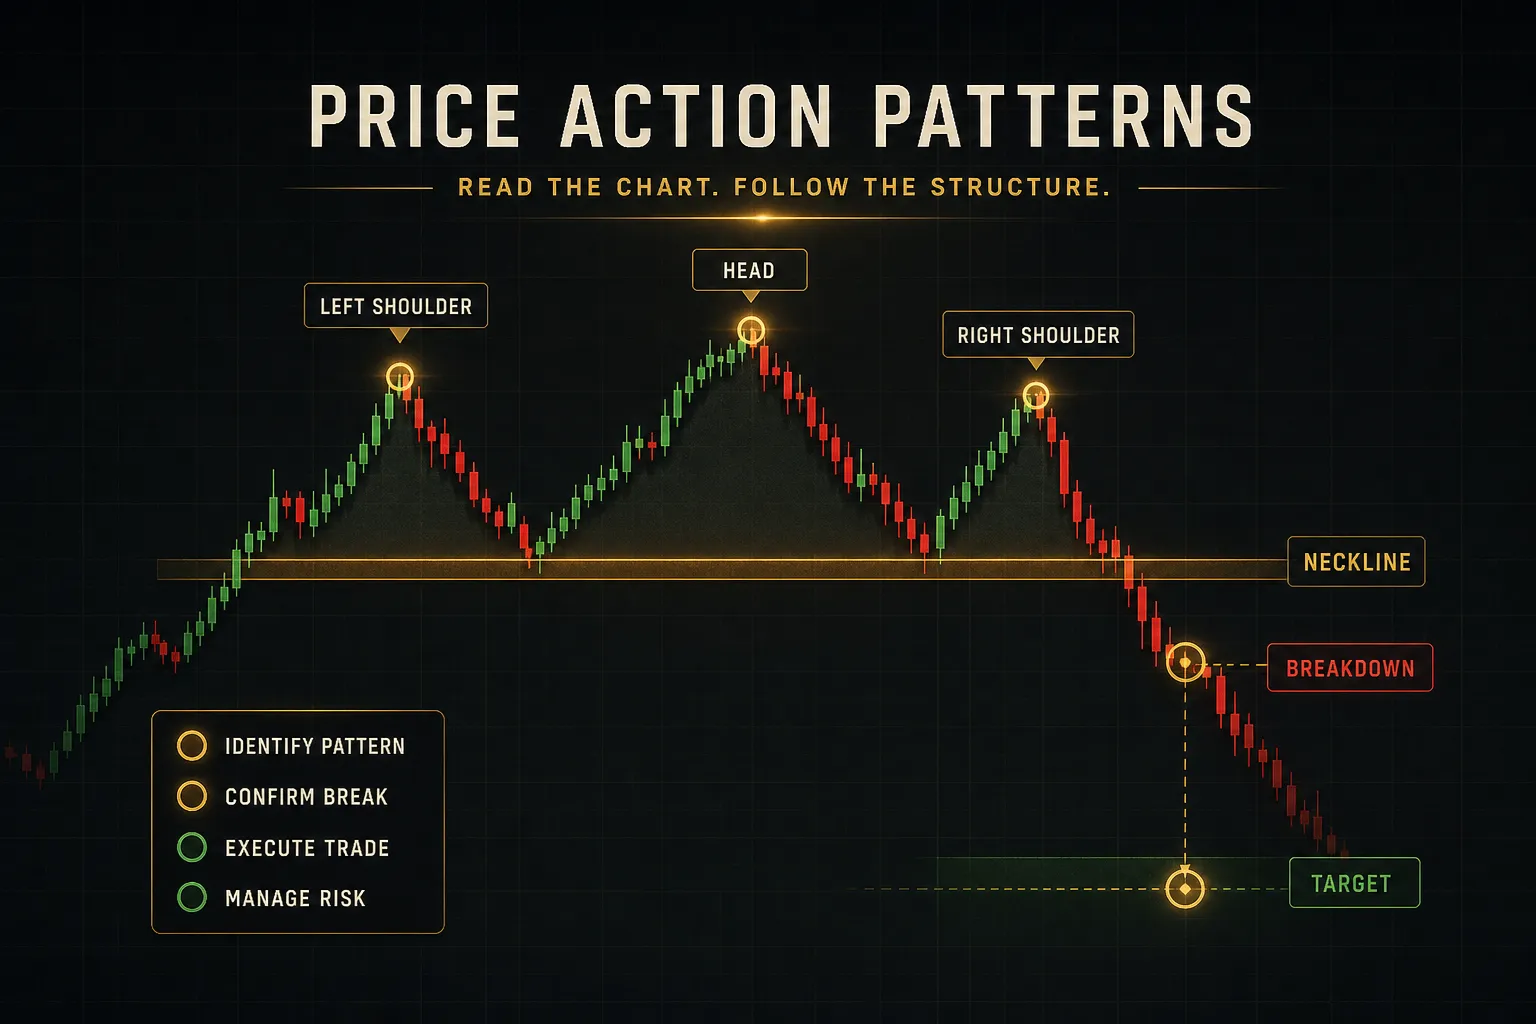
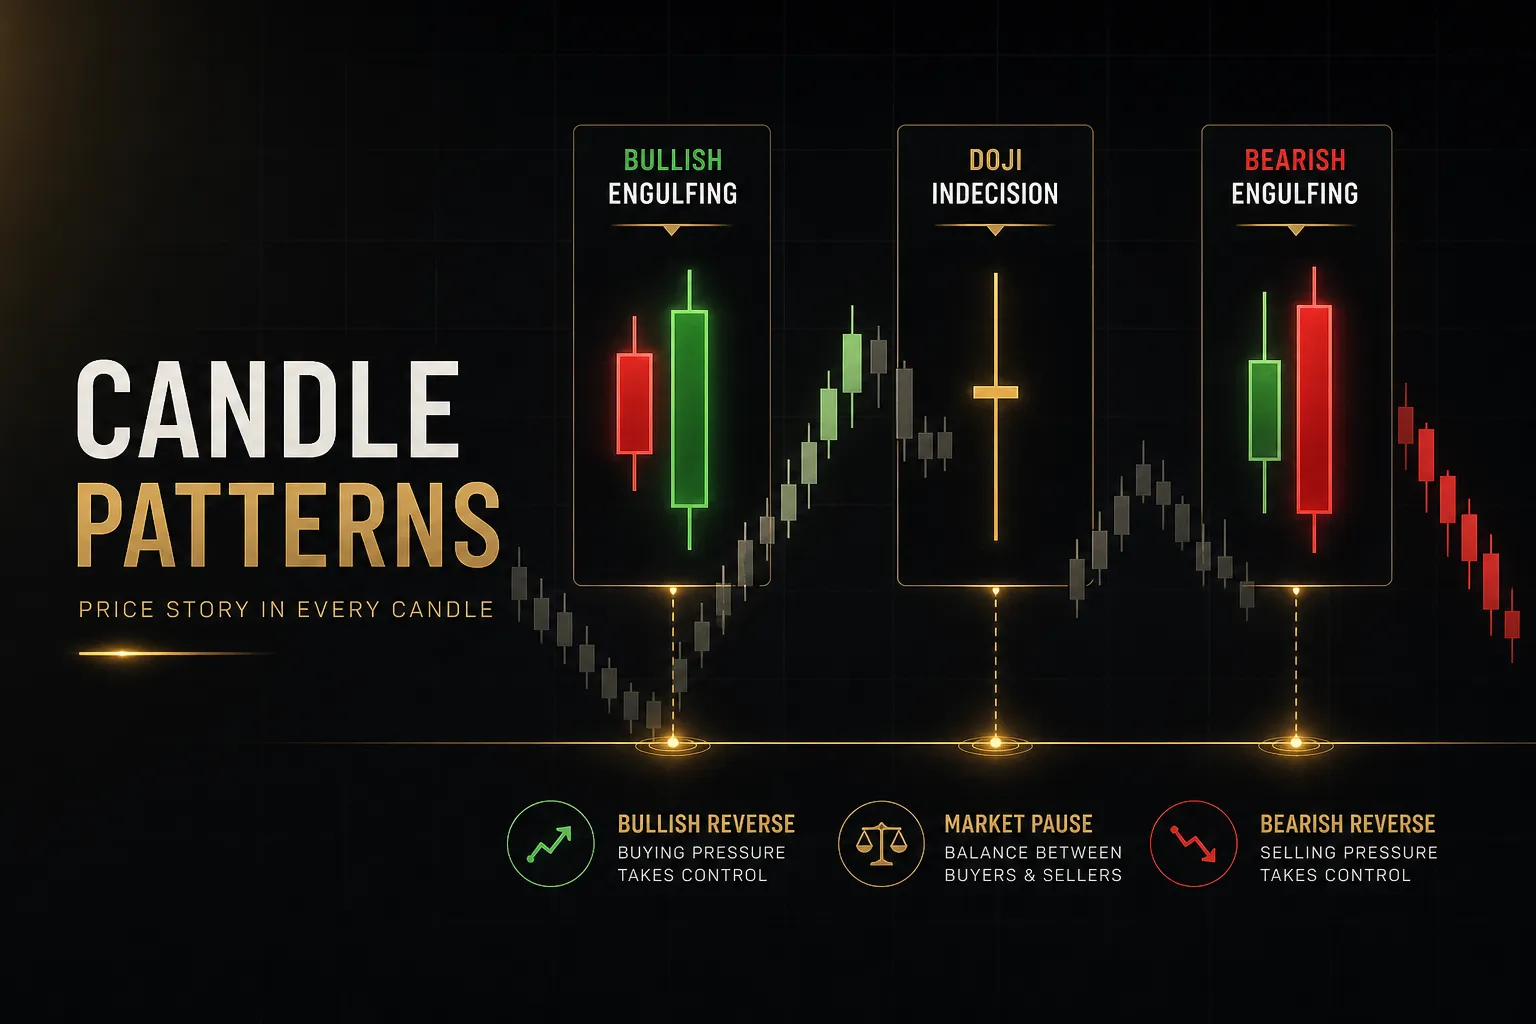
Doji Candle Pattern: What It Actually Signals
On this page
When a Candle Says “I Don’t Know”
Every candle on a chart tells you who won the session.
Buyers or sellers.
Except one.
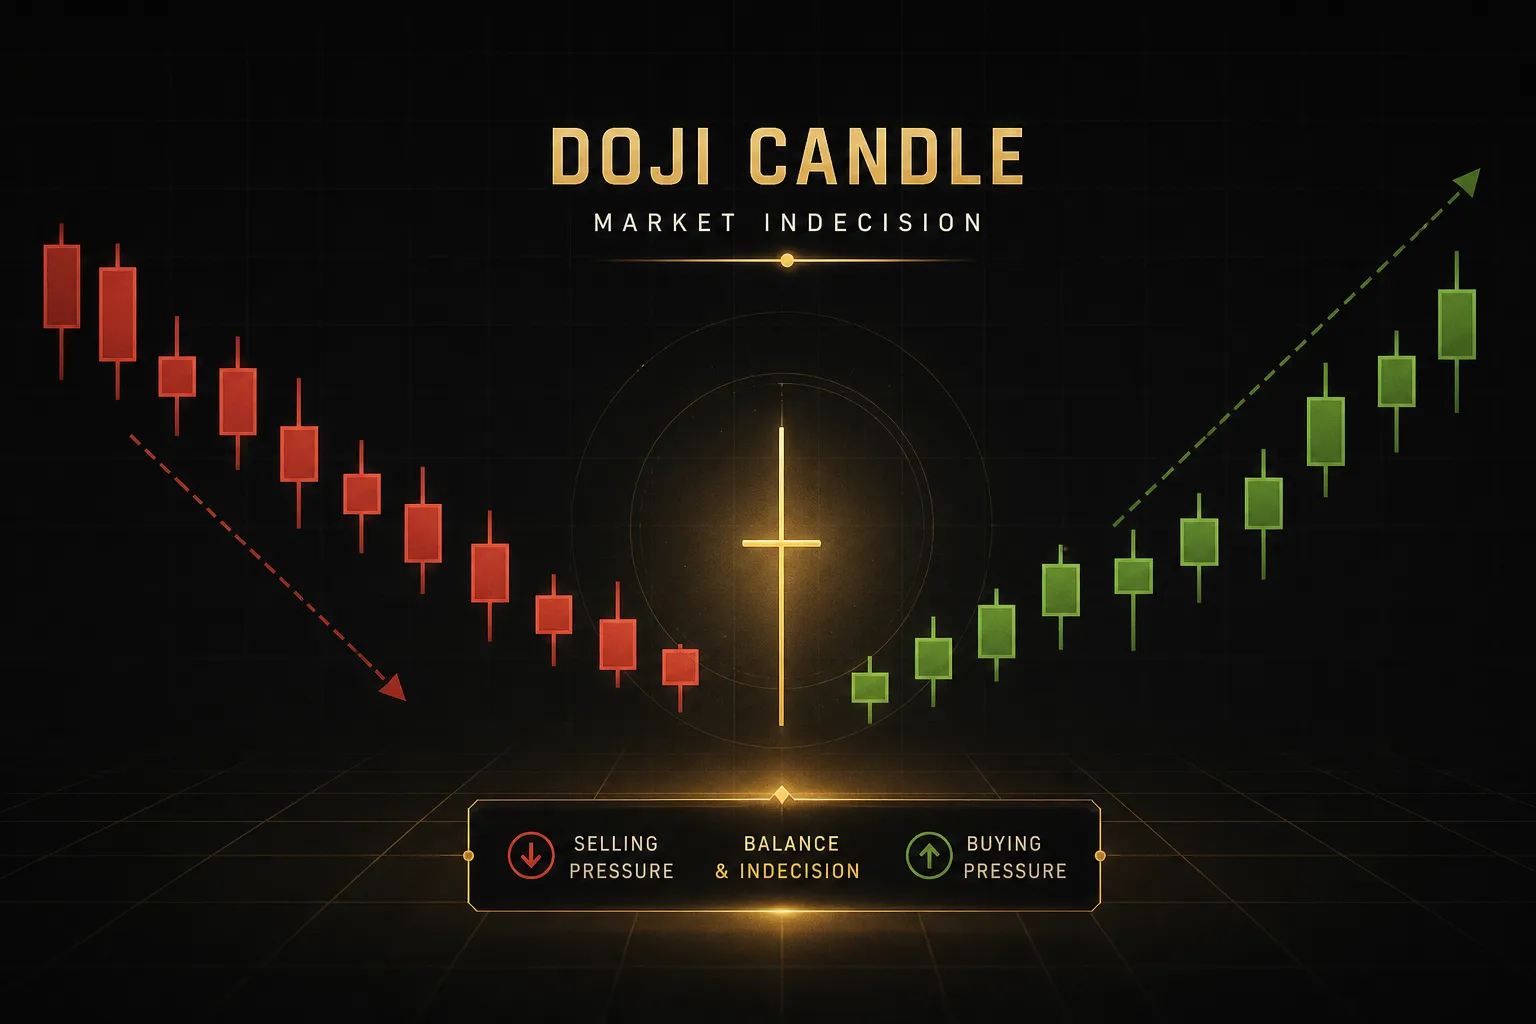
The doji candle pattern forms when the open and close land at nearly the same price, leaving a real body so thin it looks like a cross or a plus sign.
Nobody won.
That’s the entire message.
Most trading guides stop there and jump straight to “reversal signal.”
That leap costs traders money.
A doji at the top of a three-week uptrend, sitting on a tested resistance level with volume triple its average, means something very different from a doji drifting through a quiet Tuesday afternoon range.
Same shape.
Opposite value.
A doji is not an answer. It is a question the next candle has to answer for you.
This guide takes a context-first approach.
You’ll get an objective way to identify a doji using average true range instead of eyeballing it, a breakdown of the four main types and where each one carries weight, a step-by-step confirmation framework with real entry and stop rules, and an honest look at what the backtesting evidence actually says.
The problem with most doji content is that it teaches shape recognition and skips the risk framework.
Recognizing a doji takes about four seconds.
Trading one well takes a process.
What Is a Doji Candle?
A doji is a candle on a Japanese candlestick chart where the open and close are effectively identical, producing a real body that is a tiny fraction of the candle’s total high-low range. Most practitioners use a threshold of under 5% to 10% of the full range.
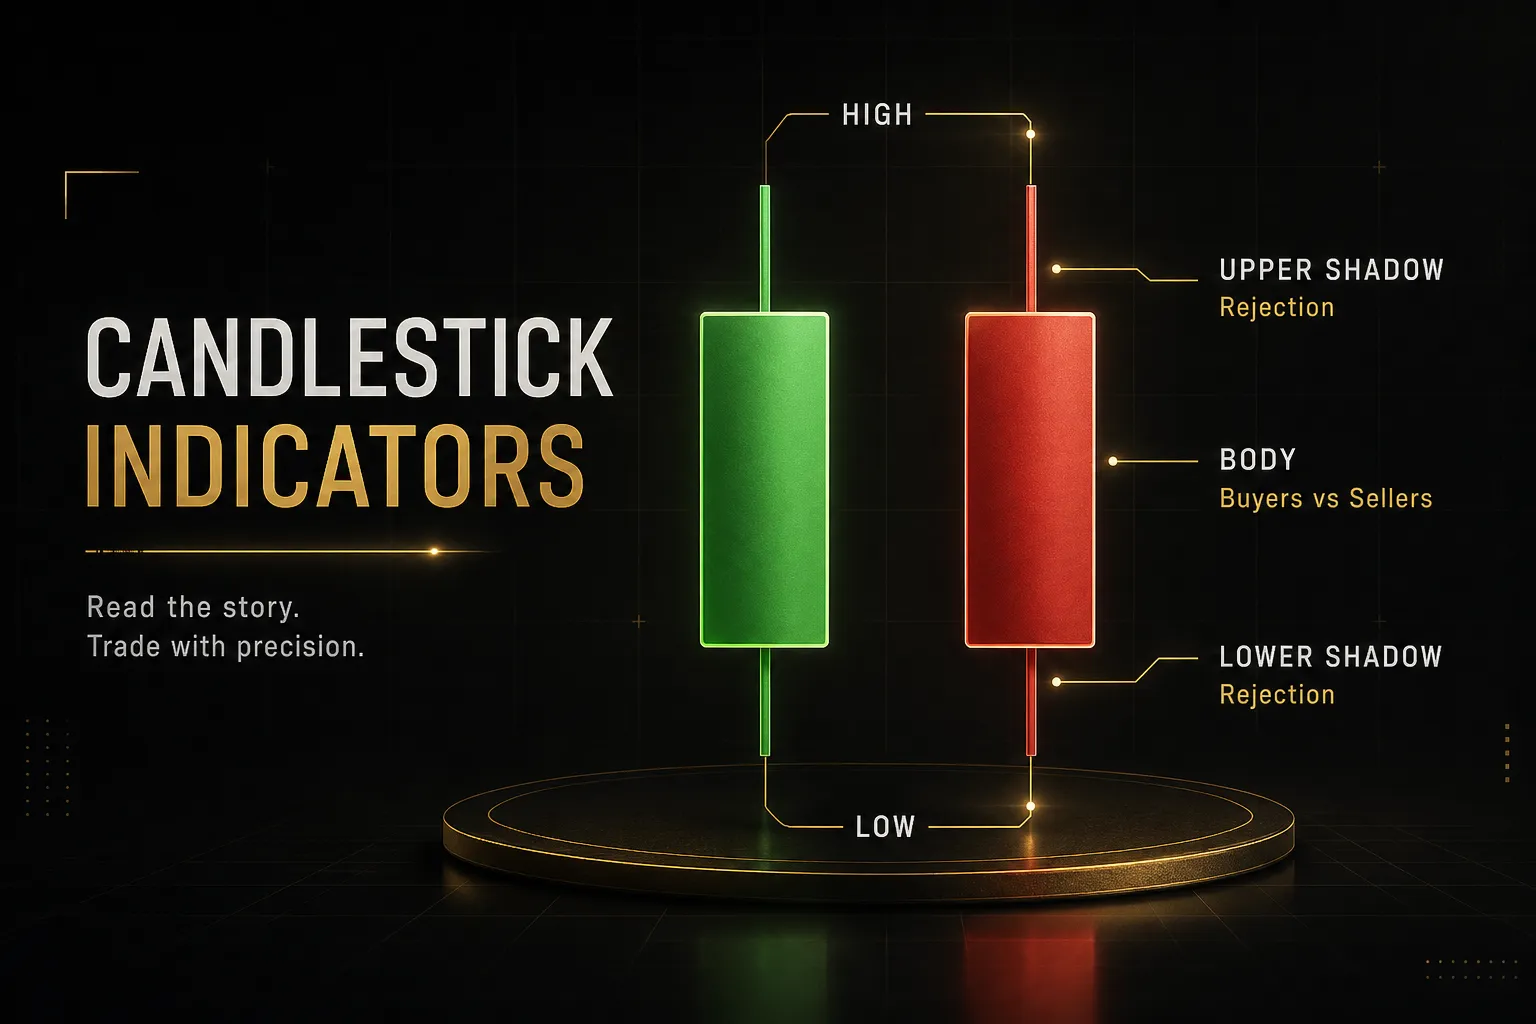
The candle still has upper and lower shadows, sometimes long ones.
Price moved.
It just came back.
Think of it as a tug-of-war where both teams pulled hard for an hour and the flag ended up exactly where it started.
Effort without displacement.
That’s what market indecision looks like in one bar of open high low close data.
The size of those shadows tells you how much fighting happened.
A doji with barely any wicks means the session was quiet and directionless. A doji with wicks stretching in both directions means buyer and seller pressure were both violent, and both got rejected.
Spotting a Doji Objectively
Here’s where most traders go wrong: they judge doji by how it looks on screen.
Zoom in and every candle has a small body.
Zoom out and nothing qualifies.
Use a volatility-adjusted rule instead.
Compare the absolute body size (close minus open) to the average true range over the last 14 periods.
- Body under 10% of the candle’s own high-low range is the standard baseline definition.
- Body under 5% of the 14-period ATR is a tighter filter that adapts to the instrument. A 10-pip body on EUR/USD during a calm Asian session is not the same thing as a 10-pip body during a US CPI release.
- Total range at least 50% of ATR ensures you’re not flagging a dead, illiquid bar as a meaningful signal.
That third filter matters more than people expect.
A candle with a two-pip body and a three-pip range isn’t indecision.
It’s nothing happening.
And one non-negotiable rule: a doji only exists once the candle closes.
A forming candle can look like a textbook dragonfly with eight minutes left and finish as a full bearish engulfing bar.
Acting on an unclosed candle is how traders end up chasing signals that repaint out of existence.
Doji vs Spinning Top
These two get confused constantly, and the distinction is genuinely useful.
A spinning top has a visibly larger real body, typically 10% to 30% of the total range, with shadows on both sides.
A doji’s body is essentially a line.
The difference in meaning is one of degree.
A spinning top says directional pressure existed but was weak and got absorbed. A doji says the two sides finished dead level.
Practically, a spinning top is a caution flag.
A doji at a key level is a stop sign.
Both demand price action confirmation before you do anything, but the doji represents a cleaner balance point, which is why it tends to appear more often at genuine turning points.
Doji Types and Where They Sit
Four shapes cover almost everything you’ll see.
What separates a tradeable doji from chart noise isn’t which of the four appeared, it’s where it appeared.
| Doji Type | Shape Description | Strongest Location | What It Suggests | Low-Value Context |
|---|---|---|---|---|
| Standard Doji | Tiny body near the middle of the range, short shadows on both sides | After an extended directional move of 5+ candles | Momentum has stalled; the prior trend lost its sponsor | Mid-range in a tight consolidation where it appears every few bars |
| Long-Legged Doji | Tiny body with long upper and lower shadows, often 3x ATR total range | At a trend extreme after a fast, near-vertical move | Extreme two-way volatility with no net winner; possible exhaustion | Around scheduled news releases where the spike is mechanical, not structural |
| Dragonfly Doji | Long lower shadow, open and close both near the session high, minimal upper wick | At tested support after a downtrend of 3+ candles | Sellers pushed price down and were fully rejected before the close | Mid-range on a sideways day with no level underneath |
| Gravestone Doji | Long upper shadow, open and close both near the session low, minimal lower wick | At tested resistance after an uptrend of 3+ candles | Buyers drove price up and lost every pip of it before the close | Choppy conditions where price has crossed the same level five times |
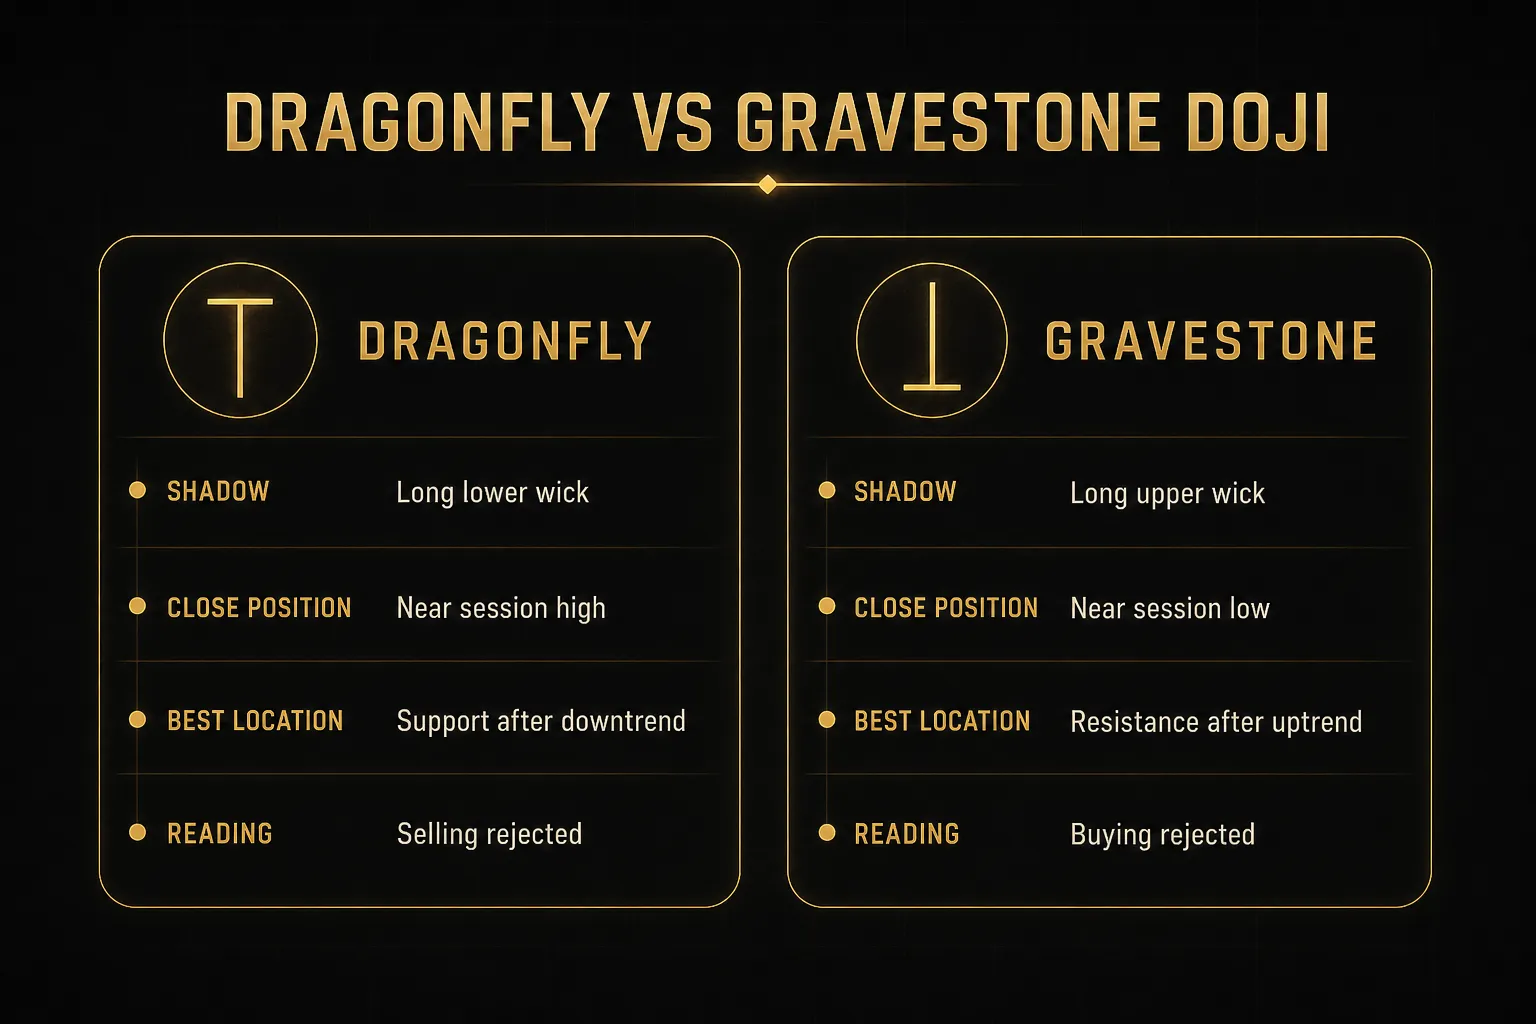
Dragonfly vs Gravestone Doji
These are mirror images, and they’re the two most cited variants for good reason. Both show a complete rejection of one direction within a single session.
A dragonfly doji at support after a downtrend is a story you can read: sellers took control, drove price to a new low, and then buyers absorbed all of it and pushed the close back to the top of the range.
The long lower shadow is the footprint of failed selling.
Now put that identical candle in the middle of a sideways range with no support level beneath it.
Same shape, no story.
Price wandered down and wandered back.
That happens constantly in low-volatility conditions and predicts nothing.
The gravestone doji reverses the logic.
Long upper shadow, close at the low, appearing right at resistance after an uptrend means buyers spent their ammunition and gave it all back.
That’s meaningful supply.
The same gravestone in choppy conditions, where price has whipsawed through the same zone repeatedly, tells you the range is still a range.
Nothing more.
What a Long-Legged Doji Shows
The long-legged doji is the most dramatic of the four and the most misread.
Long shadows in both directions mean the market genuinely tried both ways.
Buyers pushed hard.
Sellers pushed hard.
The close landed at the open anyway.
After a fast, near-vertical move, that pattern often marks exhaustion rather than a clean reversal.
Distinguish those two carefully.
Exhaustion means the trend is out of fuel and may now consolidate sideways for twenty candles. A reversal means price turns and runs the other way.
Traders who treat every long-legged doji at a high as a short signal end up stopped out by a sideways grind.
Wait for structure to break before assuming direction.
Context Changes Everything
Here’s the uncomfortable truth about doji frequency: on a 15-minute forex chart during quiet hours, you might see six or seven candles that meet the technical definition.
Six or seven “reversal signals” per session, most of which reverse nothing.
Dojis cluster in low-volatility, sideways ranges.
That’s exactly where they carry the least information, because in a range, everything is indecision.
Three questions filter the noise:
- Is there a trend to reverse? A reversal pattern needs something to reverse. Check that the prior 5 to 10 candles show a directional structure of higher highs and higher lows, or lower highs and lower lows.
- Is it sitting on a level? Support and resistance zones, prior swing highs and lows, round numbers, or a major moving average. A doji floating in open space has no reference point.
- Is the volume unusual? A doji on triple average volume means a genuine transfer of positions happened at that price. A doji on thin volume means nobody showed up.
Turning a Doji Into a Trade
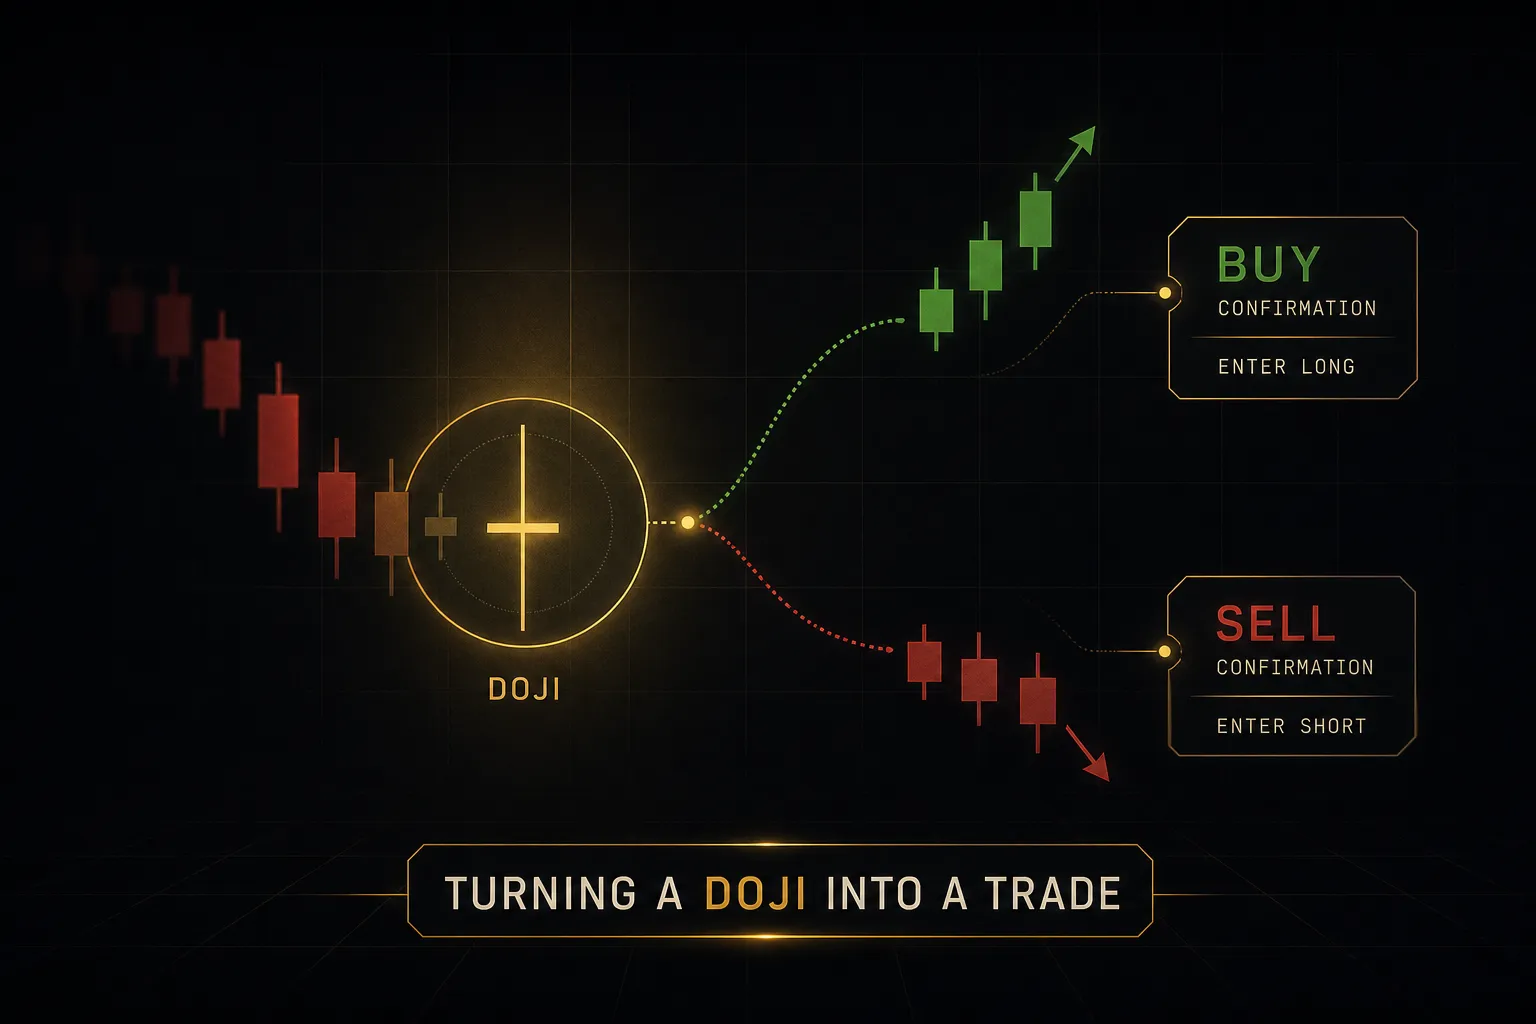
Recognizing the pattern is the easy part.
Converting it into an entry with defined risk is where most traders lose the thread.
The framework below separates the signal (the doji) from the trigger (what actually gets you in) and the invalidation (what gets you out).
Never let those three collapse into one.
Your Confirmation Checklist
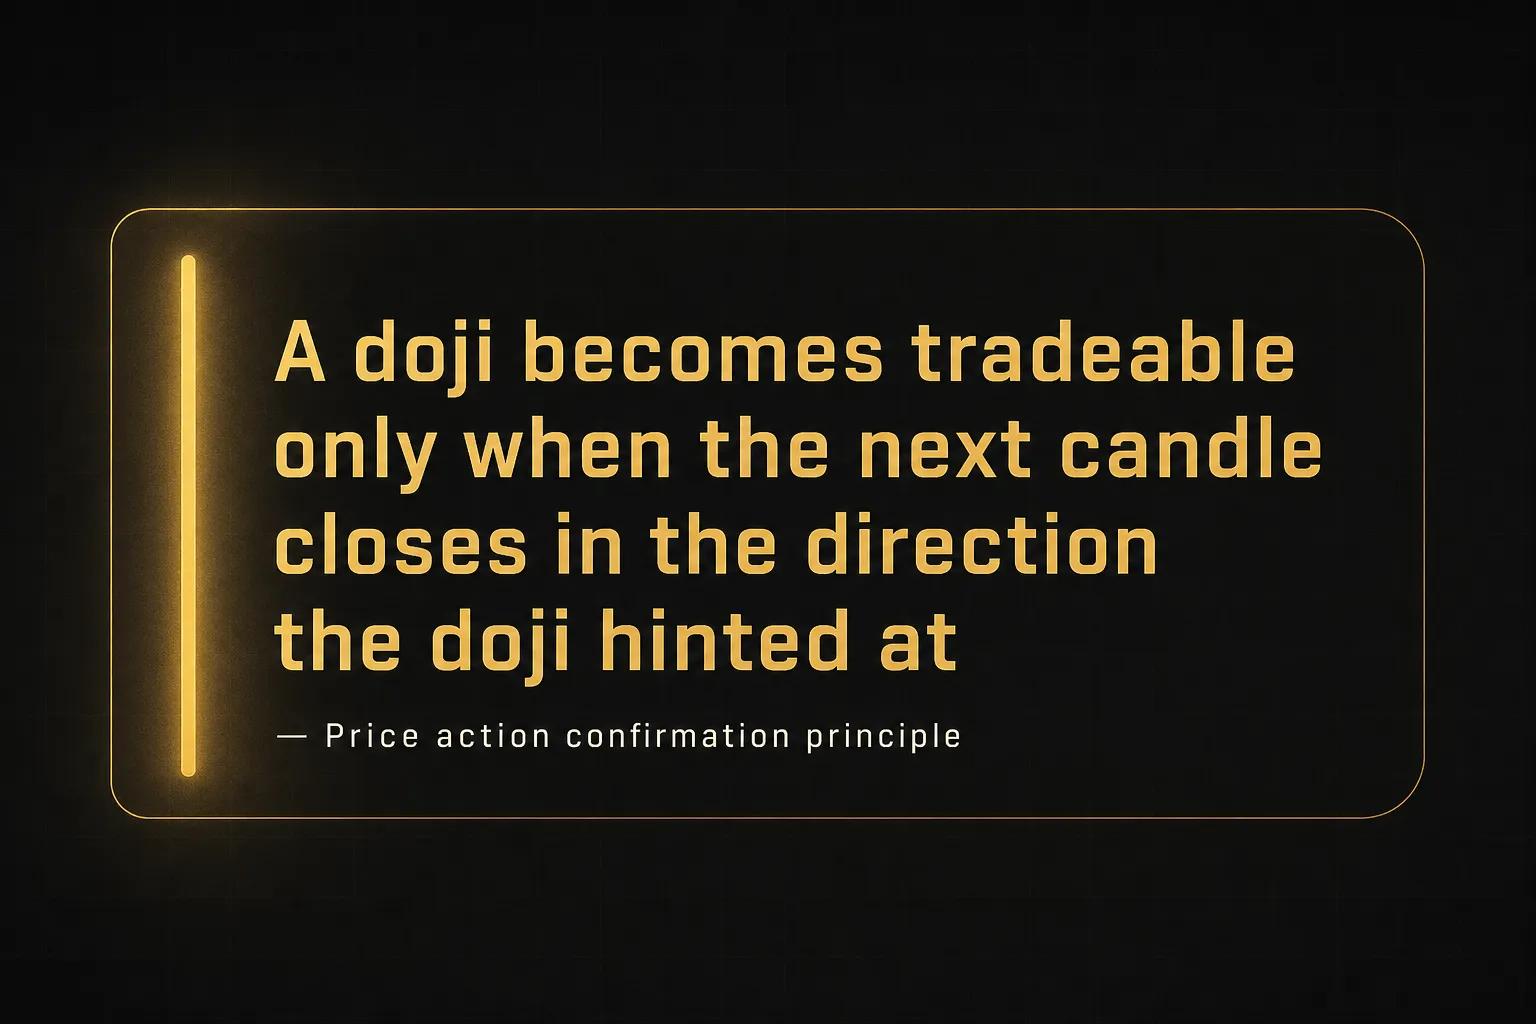
- Wait for the next candle to close. The single highest-value filter available. A doji followed by a strong candle closing in the opposite direction of the prior trend is a confirmed signal; a doji followed by a continuation candle means the trend absorbed the pause and is still running.
- Check market structure. Identify whether the last 5 to 10 candles built higher highs and higher lows or the reverse. A bullish doji signal against an intact downtrend structure is a counter-trend bet, and those need a wider margin of error.
- Look for a volume spike. Volume on the doji or the confirmation candle at 1.5x or more of the 20-period average suggests real participation rather than a liquidity gap. Forex traders should use tick volume as a proxy and treat it as directional evidence, not absolute size.
- Read momentum with RSI or MACD. A gravestone doji at resistance while the relative strength index prints above 70 and starts hooking down carries far more weight than the same candle with RSI at 52. MACD confirmation comes from a histogram that’s been shrinking for several bars before the doji forms.
- Apply a moving average trend filter. Price relative to a 50-period or 200-period moving average tells you which side of the market you’re fighting. Bullish doji setups below a declining 200 MA fail more often than they succeed.
- Confirm on a higher timeframe. A dragonfly on the 15-minute chart is worth far more when the 1-hour and 4-hour trends agree. Multi-timeframe analysis is the cheapest filter in trading and the one most often skipped.
Entry, Stop, and Target Rules
Concrete mechanics beat vague intent.
Here’s the standard structure for a bullish doji setup, mirrored for bearish.
- Entry on the break of the doji’s high. For a bullish setup, place a buy stop one tick above the doji’s high, or enter at market once the confirmation candle closes above it. The break is your breakout confirmation that buyers actually took control.
- Stop-loss beyond the doji’s opposite wick. Place the stop below the doji’s low, plus a buffer of roughly 10% of ATR to absorb spread and noise. That low is your trade invalidation point: if price trades through it, the rejection you thought you saw wasn’t real.
- Target the prior swing level. The most recent swing high (for longs) or swing low (for shorts) is the logical first objective, since that’s where resting orders sit.
- Enforce a minimum risk-to-reward ratio. If the distance to that swing level is less than 2x your stop distance, skip the trade. A doji with a huge range creates a wide stop, and a wide stop with a nearby target is a losing structure no matter how good the pattern looks.
- Scale or trail after 1R. Moving the stop to breakeven once price travels one unit of risk in your favor converts a losing scenario into a scratch. Take partial profit at the first target and trail the rest behind swing points if structure keeps building.
One more distinction that saves accounts: a doji doesn’t have to be a trade trigger at all.
Sometimes its best use is as a risk-management alert.
You’re long, the move has run for six candles, and a long-legged doji prints.
That’s your cue to tighten the stop, take partial profit, or simply stop adding to the position.
Not chasing an extended move is a decision.
Often a profitable one.
Letting Indicators Confirm the Signal
The weakest way to trade a doji is to guess direction off one candle.
The strongest way is to treat the doji as a location marker and let independent tools vote on direction.
That’s the logic behind a signal-then-level approach.
The doji identifies where something interesting happened.
Trend tools identify whether it fits the broader picture.
PipTrend’s multi-timeframe table does this in one glance: it shows trend direction across several timeframes simultaneously, so you can see immediately whether a bullish doji on the 15-minute chart is supported by the 1-hour and 4-hour trends or fighting them. The trend-color candles apply the same filter directly on the chart, coloring price action by underlying trend state rather than by individual bar direction.
When a dragonfly doji forms at support and the timeframe table shows alignment across three periods, you have a confluence setup.
When it forms against every higher timeframe, you have a coin flip with extra steps.
Reliability, Backtesting, and Common Traps
Time for the part most candlestick articles avoid.
Academic and practitioner testing of standalone candlestick patterns has consistently produced modest results.
Studies examining pattern performance across equity and currency markets generally find that isolated candlestick signals rarely generate a consistent edge once spreads, commissions, and slippage are subtracted.
Win rates hover close to random, and the small positive expectancy that shows up in raw price data tends to vanish under realistic transaction costs.
That’s not an argument for ignoring dojis.
It’s an argument for what the pattern actually is: a filter, not a system.
The doji narrows your attention to moments where control changed hands.
Your rules for confirmation, position sizing, and stop-loss placement determine whether that attention converts into profit.
The shape contributes maybe 20% of the outcome.
Risk management contributes the rest.
Backtesting Without Fooling Yourself
If you want to know whether a doji setup works on your instrument and timeframe, test it.
But candlestick backtesting is unusually easy to get wrong.
Four traps account for most inflated results:
- Look-ahead bias. Coding a rule that references the confirmation candle’s close while entering at that same candle’s open. Your backtest gets information the live market wouldn’t give you until the bar finished.
- Inconsistent definitions. Using a 5% body-to-range threshold on one dataset and 10% on another changes the number of qualifying signals dramatically, sometimes by a factor of three. Lock the definition before you test, not after you see results.
- Survivorship bias. Testing stock patterns only on companies still listed today quietly removes every firm that collapsed. The reversal signals that failed catastrophically are missing from your sample.
- Ignoring costs. A strategy with a 53% win rate and 1:1 risk-reward is profitable on paper and negative after a two-pip spread on a 15-pip stop. Model spread, commission, and one tick of slippage on every fill.
A useful minimum: 200 or more qualifying signals across at least two years of data, tested on out-of-sample periods you didn’t use to build the rules.
Session Timing and Gap Traps
Some dojis are structural.
Some are just plumbing.
Forex sessions create predictable low-liquidity windows.
The gap between the New York close and the Tokyo open produces thin, choppy candles where a doji reflects an absence of participants rather than a battle between them.
The same applies to the last hour of the Asian session before London arrives.
Scheduled news makes it worse in the opposite direction.
A central bank statement can produce a textbook long-legged doji on the one-minute chart purely from the spike-and-retrace mechanics of a liquidity vacuum.
That candle looks identical to a genuine exhaustion signal and means nothing structurally.
Weekend gaps in forex create another distortion.
The Sunday open frequently gaps from Friday’s close, and depending on your broker’s server time, that gap can produce artificial daily candles with distorted opens.
Practical rules: discount dojis formed during your instrument’s known low-liquidity window, ignore any doji that forms within 15 minutes of a high-impact release, and check that your session start times match the sessions you actually trade.
And remember the base rate.
Dojis are common in quiet, sideways markets and rarer at genuine trend extremes.
The rare ones are worth your attention.
The common ones are wallpaper.
Doji Candle FAQs
What does a doji candle indicate?
A doji indicates market indecision, where buying and selling pressure finished the session in near-perfect balance with the close returning to the open. It signals that the prior directional momentum has paused, not that it has necessarily reversed.
The meaning depends entirely on location.
After an extended trend at a key support and resistance level, a doji suggests the trend is losing sponsorship.
In the middle of a sideways range, it just describes the range.
Is a doji a buy or sell signal?
A doji on its own is neither a buy nor a sell signal. It has no inherent direction, because by definition the open and close are equal and neither side won.
Direction comes from three external factors: where the doji formed relative to trend, what the next candle’s close does, and whether the broader trend context supports the move.
A dragonfly at support with a strong bullish confirmation candle is a buy setup.
The same dragonfly mid-range is nothing.
What happens after a doji candle?
Most of the time, the prior trend simply continues. Dojis appear frequently, and the majority resolve as brief pauses rather than turning points.
The exception is the doji at a trend extreme with volume confirmation and momentum divergence on the relative strength index.
Those resolve into reversals or extended consolidations far more often.
The next candle’s close is your fastest and most reliable read on which scenario you’re in.
Which doji is most powerful?
The dragonfly doji at established support and the gravestone doji at established resistance are generally considered the strongest variants. Both show a complete rejection of one direction within a single session, which is more informative than a standard doji’s simple stall.
But the qualifier matters more than the ranking.
Without an elevated volume reading and a follow-through candle in the expected direction, neither shape has demonstrated an edge in testing.
How do you trade a doji candlestick pattern?
Wait for the next candle to close in the direction the doji implies, then enter on a break of the doji’s high (for longs) or low (for shorts). Place the stop-loss beyond the doji’s opposite wick with a small ATR buffer, and target the prior swing level.
Skip any setup where the distance to the target is less than twice your stop distance. Confirm with market structure, volume, a moving average trend filter, and higher-timeframe alignment before committing capital.
Are doji candles reliable?
Doji candles are not reliable in isolation.
Testing consistently shows that standalone candlestick patterns produce little to no edge after spreads, commissions, and slippage are accounted for.
Reliability improves substantially when the doji is filtered by objective criteria: an ATR-based identification threshold, a defined trend context, elevated volume, MACD confirmation or RSI positioning, and multi-timeframe analysis. The pattern’s value is in narrowing your focus, not in predicting price by itself.
The Bottom Line on Doji Candles
A doji is a question mark on your chart.
Structure, volume, and indicators are what turn it into a sentence.
The shape alone tells you the session ended in balance.
That’s genuinely useful information about who is in control, but it’s information about the past, not a forecast.
Every attempt to trade the shape without the context runs into the same wall: dojis are common, and common patterns don’t carry rare information.
Here’s the one thing to do tonight.
Open your chart, find the most recent doji, and answer two questions before anything else: where did it form relative to the prevailing trend and the nearest key level, and what did the next candle’s close do?
If you can’t answer both, you don’t have a trade.
The goal was never to find the perfect doji.
It’s to build a repeatable confirmation process, entry rule, stop-loss placement, and risk-to-reward filter that works on any candle you happen to see.
Do that, and the individual pattern stops mattering so much.
Which is exactly the point.
Sources
Risk Disclaimer: Trading involves risk. Past performance doesn't guarantee future results. Only trade with money you can afford to lose. PipTrend is a tool to assist your trading decisions, not financial advice.