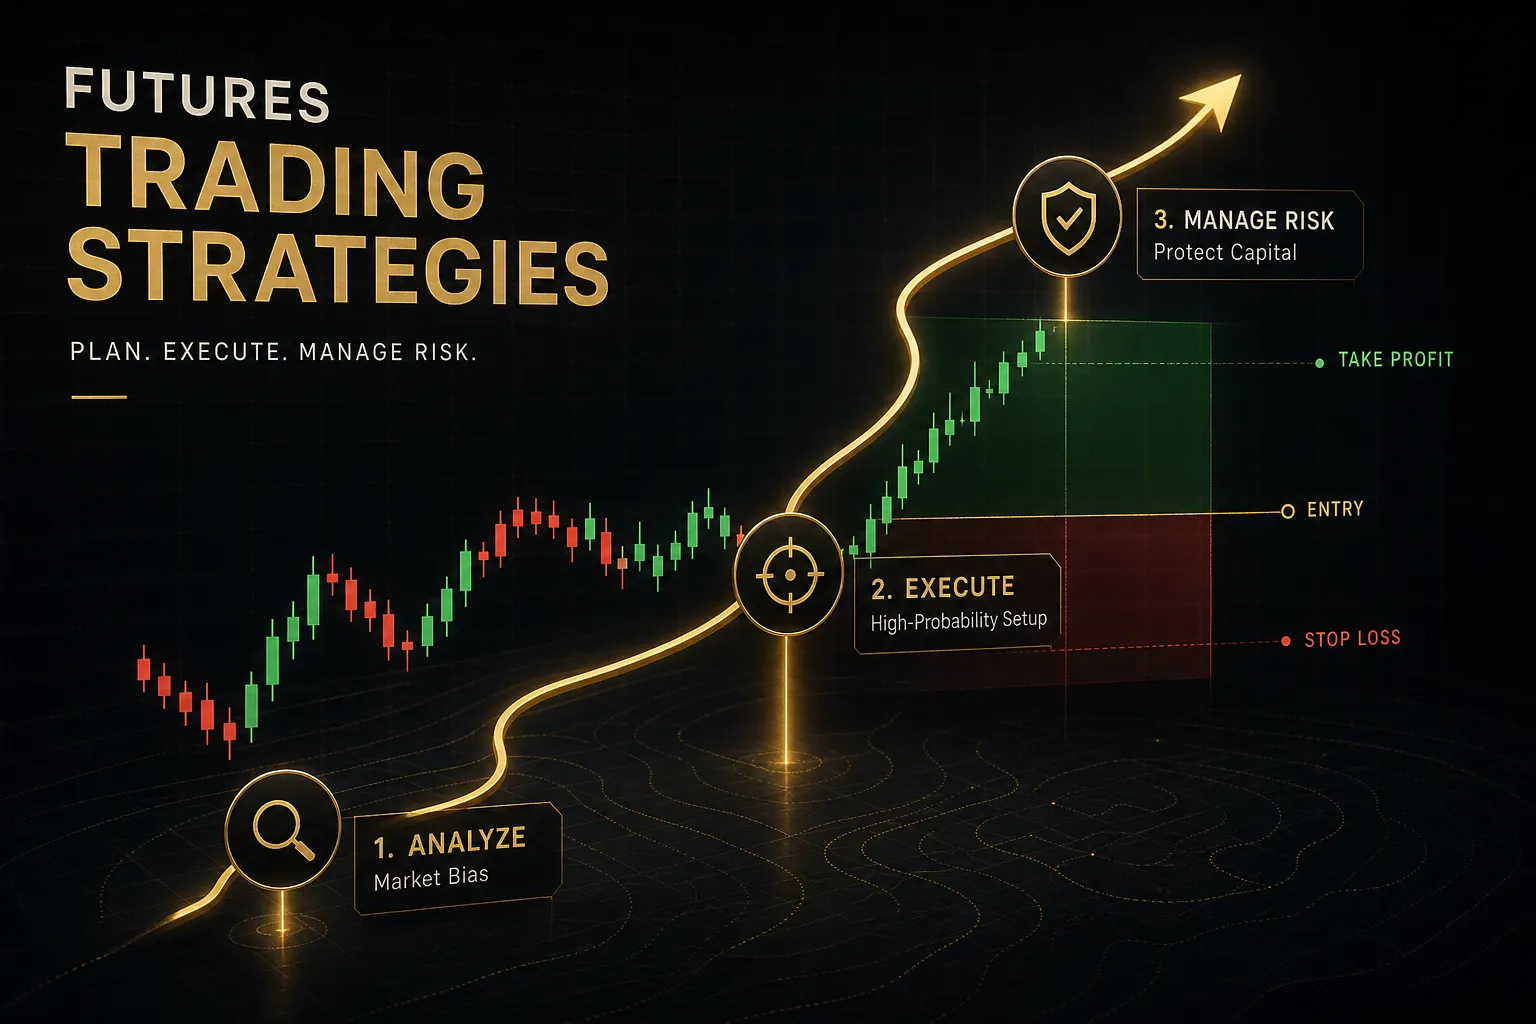
Futures Trading Strategies: A Practical Framework
On this page
Why Most Futures Strategies Fail in Practice
Ask ten futures traders what strategy they use and you’ll hear the same five words: trend following, breakouts, scalping, mean reversion, pullbacks. Ask them when that strategy stops working and the room goes quiet.
That gap is where most accounts die.
A strategy is not a set of entry rules. It’s a bet that a specific market regime will persist long enough for your edge to play out.
Trend following in a chopping range is a losing machine.
Mean reversion during a sustained directional expansion is worse, because the losses cluster and the drawdown arrives faster than the recovery.
Same rules, opposite outcome, entirely because of context.
This guide takes a different angle from the usual list of “guaranteed setups.” The two things that actually determine your results are strategy selection (matching the method to current conditions) and execution discipline (following rules you defined in advance, sized correctly).
Leverage complicates all of it.
A strategy with a 65% win rate and a solid risk-to-reward ratio can still blow up an account if position sizing ignores tick value and notional value. Futures give you enormous exposure for small initial margin, and traders routinely confuse the margin their broker requires with the capital genuinely at risk.
Those are different numbers.
Very different.
The strategy label tells you almost nothing about your expected outcome. Regime fit, sizing, and execution consistency tell you nearly everything.
By the end, you’ll have three things: a decision process for picking a strategy that fits the current market, a position-sizing formula with real contract math, and a realistic method for judging whether your approach has an edge or just a lucky streak.
Which Strategy Fits Which Market?
Markets alternate between two broad states: directional expansion and contraction. Almost every futures strategy is a bet on one of those states.
Your first job before any entry is to identify which one you’re in.
Here’s how the major strategy families map onto conditions, and what specifically has to be true before you commit size.
Trend Following and Breakouts
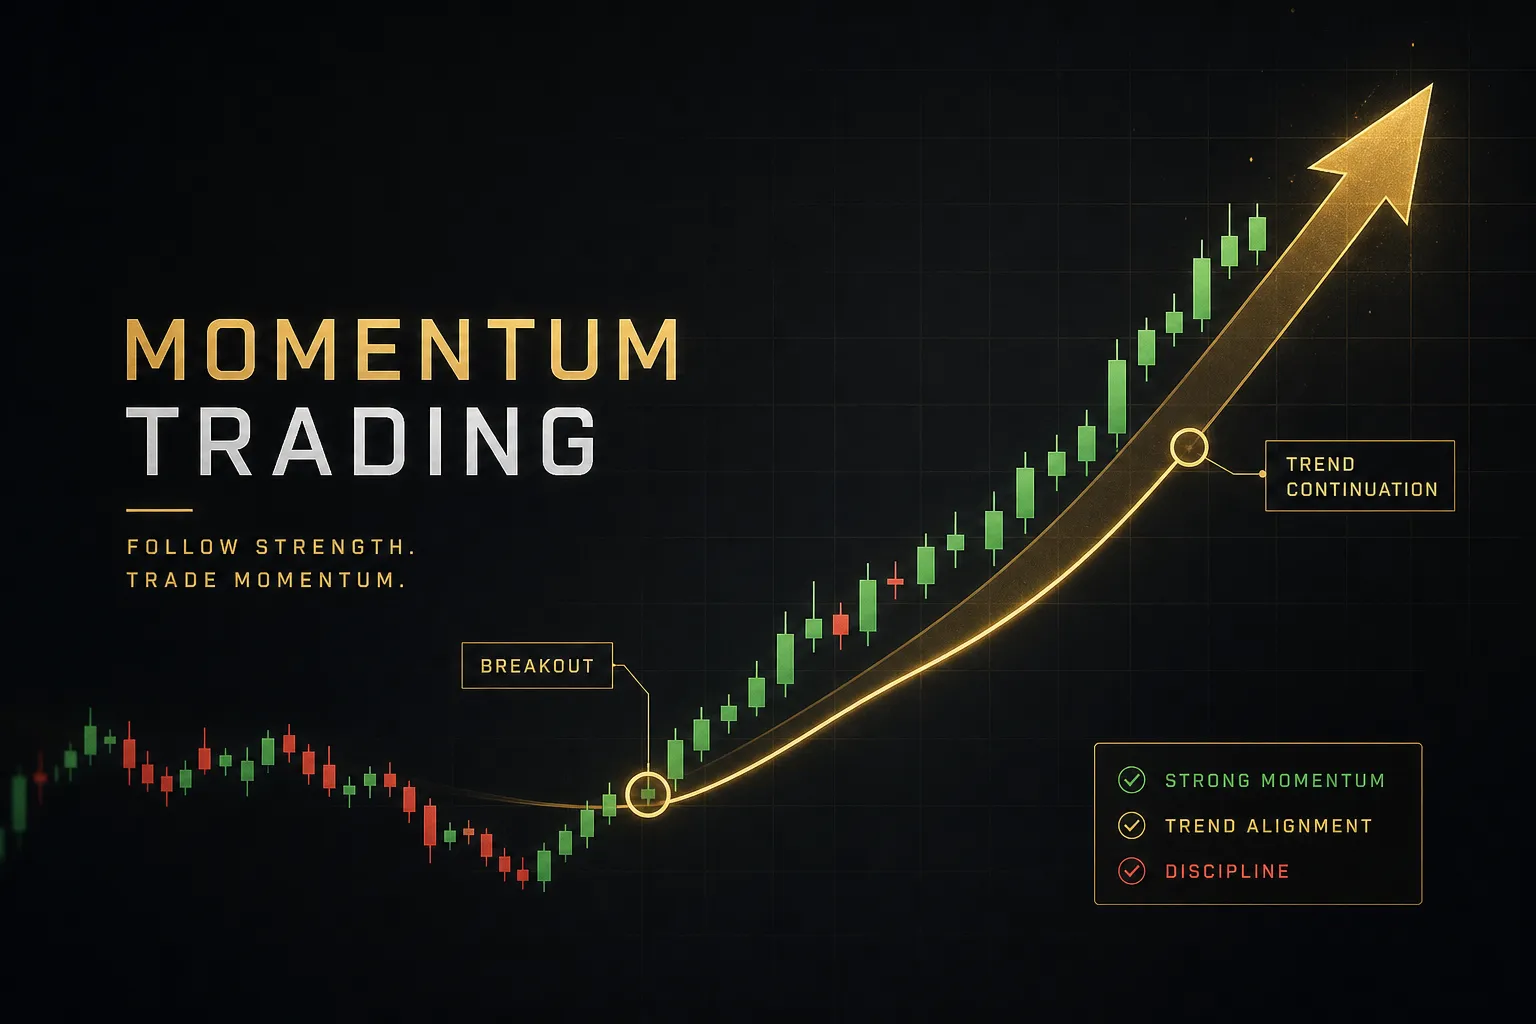
Trend following profits from sustained directional moves, and it works because of time-series momentum: instruments that have moved in one direction over a lookback window tend to continue over the near term.
But it only pays when volatility is expanding, not compressing.
Before entering, confirm the regime on a higher timeframe rather than the one you trade.
- Check higher-timeframe structure first. On the daily or 4-hour chart, you want a clean sequence of higher highs and higher lows (or lower highs and lower lows for shorts). If the last three swings overlap heavily, that’s a range wearing a trend costume.
- Use ADX as a filter, not a trigger. Readings above roughly 25 suggest directional strength; below 20 suggests chop. It tells you whether trend rules are appropriate today, not when to click buy.
- Confirm with ATR volatility. If the 14-period ATR is expanding relative to its own 50-period average, breakouts have room to run. Contracting ATR means your stop distance and target distance are both compressing, which quietly ruins your payoff math.
- Treat moving average crossover signals as context. A 20/50 crossover on a 15-minute chart is a bias indicator with lag baked in. Use it to define direction, then find your actual entry at a price level.
Breakouts deserve their own set of filters because false breakouts are the single most common way discretionary traders bleed money.
A price poking above resistance means nothing on its own.
- Align with higher-timeframe direction. Long breakouts taken against a daily downtrend fail at a materially higher rate. Trade breaks in the direction of the dominant structure.
- Require participation. Volume on the breakout bar should exceed the recent average. In futures, thin-volume breaks during the Asian session are notorious for reversing the moment London opens.
- Wait for a candle close beyond the level. Intrabar spikes through support and resistance are liquidity grabs as often as they’re genuine breakout confirmation. Closing beyond the level on your execution timeframe filters a large share of the noise.
- Prefer the retest. Entering on the pullback to the broken level gives you a tighter invalidation point and a better risk-to-reward ratio, at the cost of occasionally missing the runaway move. That trade-off favors the retest in the long run.
- The opening range breakout is the structured version. Define the first 15, 30, or 60 minutes of the New York session, then trade breaks of that range with the day’s higher-timeframe bias. It’s popular on equity index futures precisely because the range definition is objective.
Pullback and Mean-Reversion Trades
These two get lumped together and they shouldn’t be.
A pullback entry is a trend-continuation trade. Mean reversion is a counter-trend trade.
They require opposite regimes and carry completely different risk profiles.
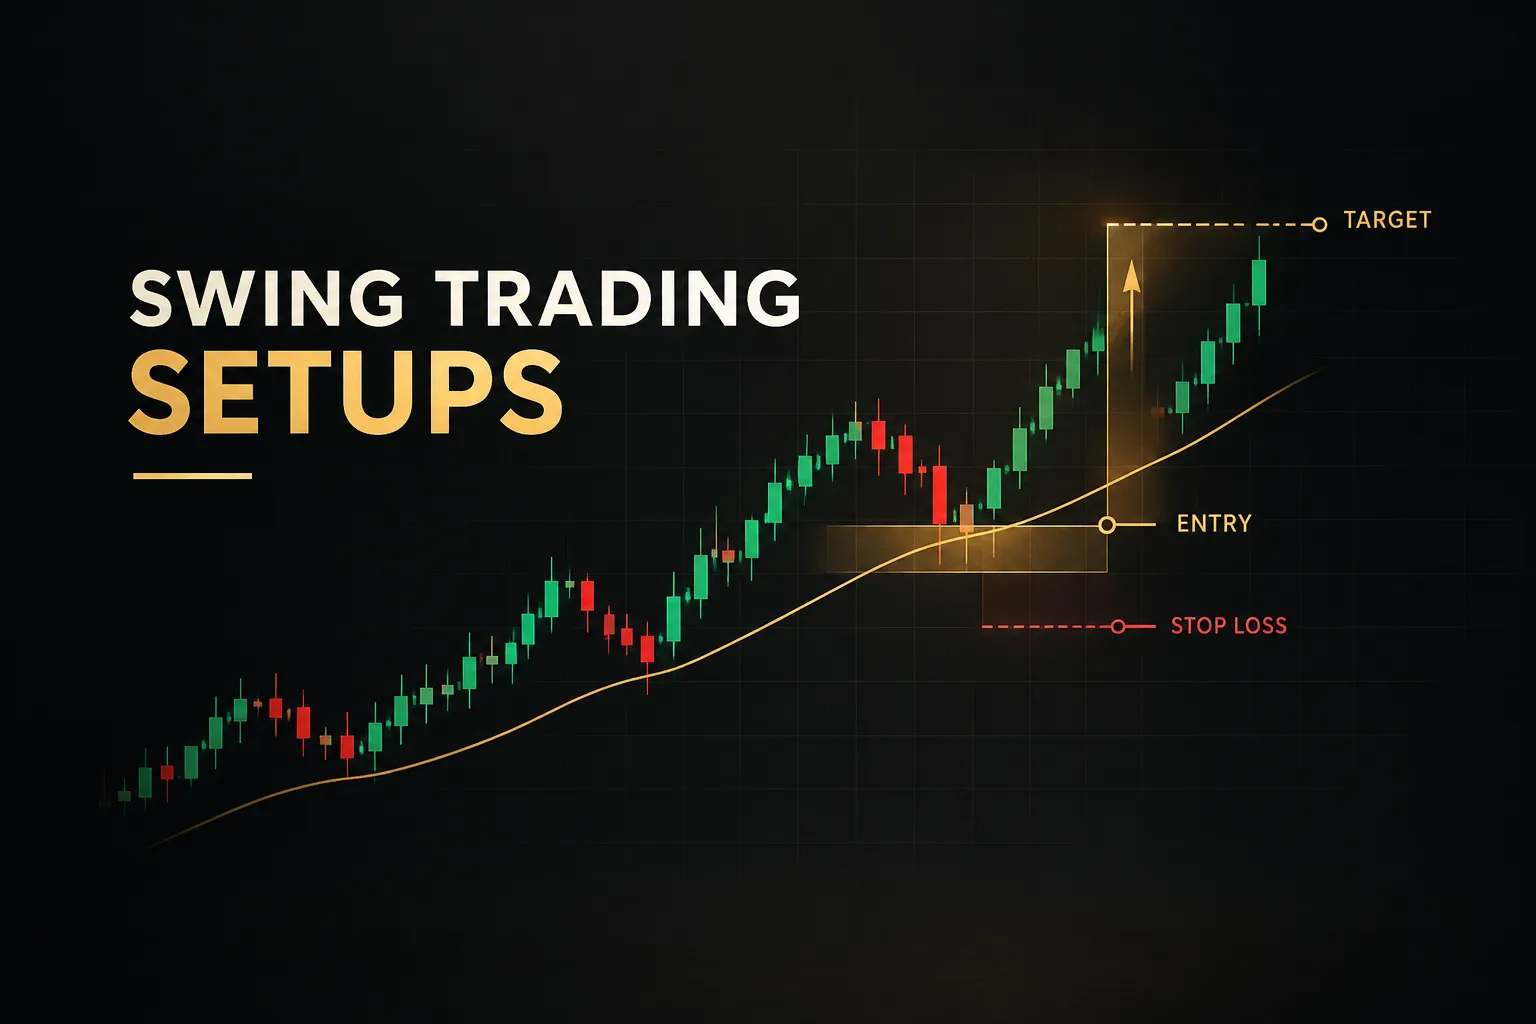
- Pullback entries need an established trend plus a temporary retracement. Price pulls back into a prior support zone, a rising moving average, or VWAP, then resumes. Your stop sits below the swing low that would invalidate the trend structure.
- Mean reversion needs a range or a genuine overextension. Well-defined boundaries, ADX under 20, and price stretched two-plus ATRs from a session mean. Without those conditions you’re not fading an extreme, you’re standing in front of a trend.
- Fading strength is how accounts die slowly, then quickly. Counter-trend trades in a strong move produce a string of small wins followed by one outsized adverse move that erases them. The distribution is skewed against you, so the sizing has to be smaller, not larger.
- Define invalidation by structure, not by pain tolerance. If price closes beyond your range boundary on the execution timeframe, the range thesis is dead. Exit. Averaging down into a losing counter-trend futures position is the fastest path to a margin call.
- Match the instrument. Equity index futures mean-revert reasonably well intraday. Energy futures during an inventory-driven trend do not. Know your contract’s personality.
Intraday and Scalping Setups
Intraday performance depends more on when you trade than on which setup you use. Liquidity determines your fills, and fills determine whether a small edge survives costs.
- Session liquidity drives everything. The Asian session is generally quieter with tighter ranges. London brings the first real volatility expansion for FX and metals. The New York cash open (9:30 a.m. ET) delivers the highest participation for equity index futures, and the 2:00 to 4:00 p.m. ET window often produces a second directional push.
- Overnight gaps change your first hour. Futures trade nearly 24 hours, so the “gap” is really an overnight range. Where price sits relative to that range at the open often defines the day’s bias and your first opening range breakout.
- Contract behavior varies enormously. Equity index futures (ES, NQ) are liquid and news-sensitive around US data. Energy (CL, NG) has violent inventory-report volatility on Wednesday and Thursday mornings. Metals (GC) respond to dollar and rate moves. Agricultural contracts have narrower liquidity windows tied to pit-session hours, which makes wide stops and slippage a real problem.
- Scalping demands the tightest cost control. If you target 6 ticks and pay 1 tick of round-trip slippage and commissions, roughly 17% of your gross edge is gone before you start. Scalping only works in the deepest contracts during peak liquidity.
Turning an Idea Into a Rules-Based Strategy
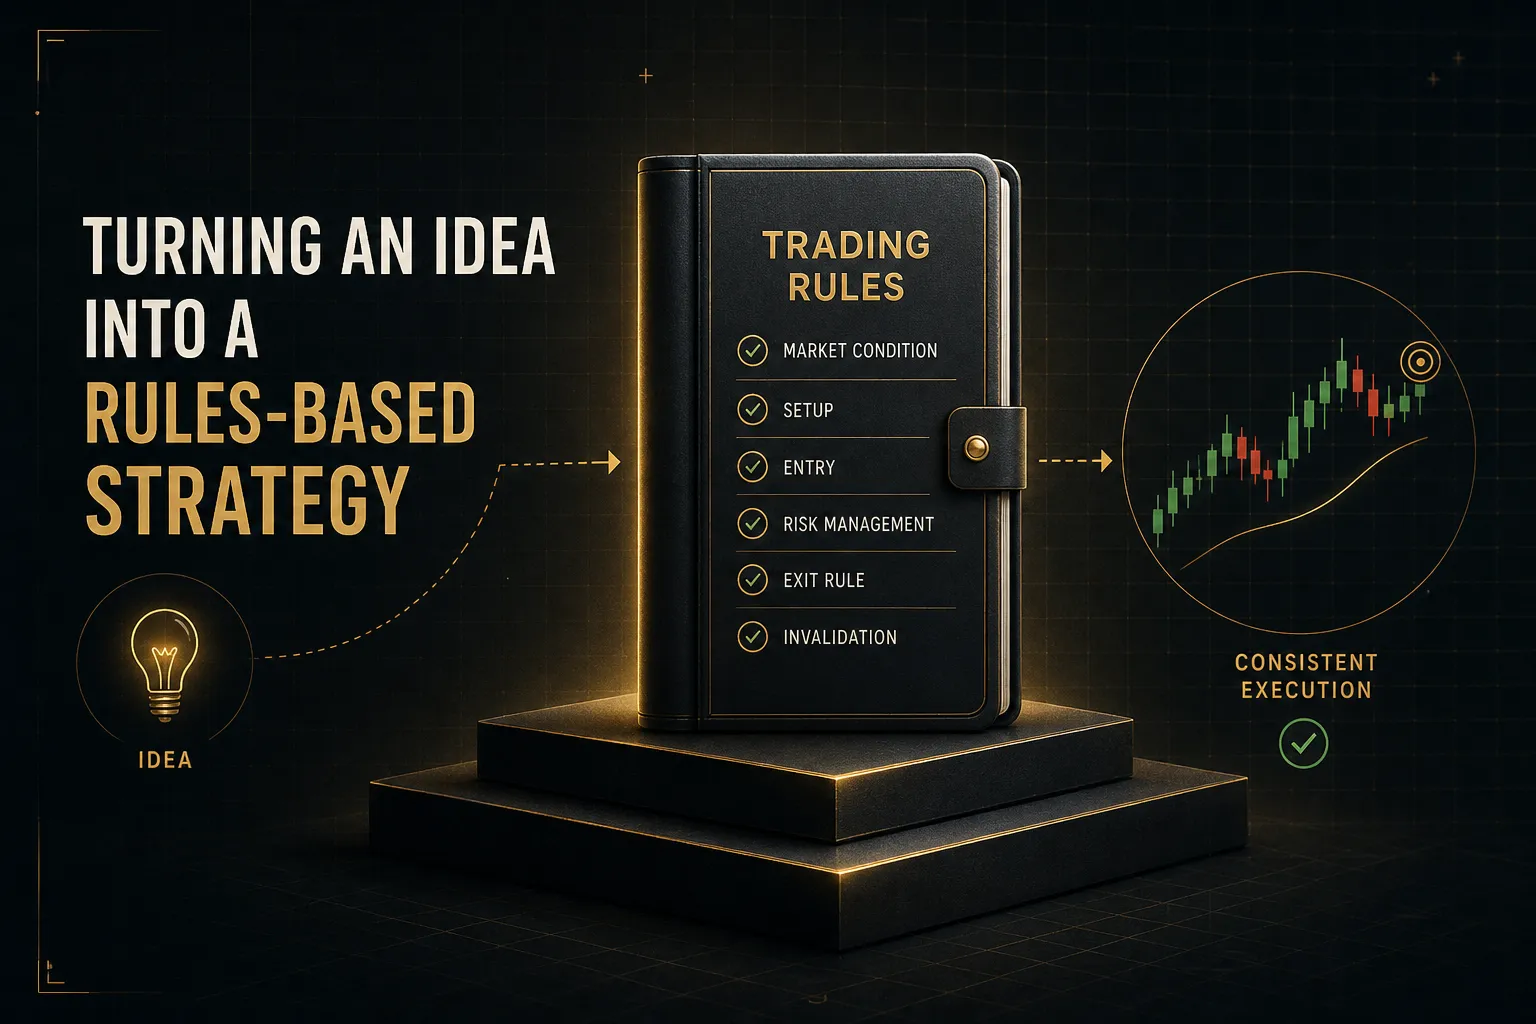
“Buy pullbacks in an uptrend” is not a strategy.
It’s a sentence.
A strategy is something a stranger could execute identically to you from written instructions.
Here’s the conversion process, worked through with a single example: an ES (E-mini S&P 500) pullback in an uptrend.
- Define the market and contract. ES front-month only. One point equals $50, one tick is 0.25 points equals $12.50. Specifying the contract fixes your tick value, which every other calculation depends on.
- Define the session window. Trade only between 9:30 a.m. and 12:00 p.m. ET. No entries outside that window, no exceptions for “good-looking” setups at 3:50 p.m.
- Define the regime filter. On the 60-minute chart, price must be above the 50-period moving average and the last two swing lows must be ascending. If either condition fails, no trades that day.
- Define the setup trigger. On the 5-minute chart, price retraces into a zone formed by a prior support level and VWAP, and prints a bullish reversal close (a close above the previous bar’s high) inside that zone.
- Define the entry. Buy stop one tick above the trigger bar’s high. If the order isn’t filled within three bars, cancel it. No chasing.
- Define the stop. Place the stop two ticks below the swing low of the pullback. Measure the distance in ticks before sizing, because the stop distance determines contract count, not the other way around.
- Define the target and exit conditions. First target at 2R (twice the stop distance). Move the stop to breakeven at 1R. Full exit at 2R or at 12:00 p.m., whichever comes first.
- Define the no-trade conditions. No entries in the ten minutes before or after major scheduled data (CPI, FOMC, NFP). No entries if the pullback stop distance exceeds 12 ticks, because the position would be too small to matter after costs.
- Define the position size. This one gets its own section, because it’s where most traders quietly break their own rules.
Position Sizing With Tick Value
The formula is simple, and applying it consistently is the single highest-value habit in futures trading.
Contracts = (account risk in dollars) ÷ (stop distance in ticks × tick value)
Work it with real numbers.
Say your account is $50,000 and you risk 0.75% per trade, which is $375. Your ES pullback setup has a stop 10 ticks away, and ES tick value is $12.50.
Risk per contract equals 10 × $12.50, which is $125. So $375 ÷ $125 equals 3 contracts.
Change one input and the answer changes.
If the stop widens to 16 ticks, risk per contract becomes $200, and you can only take 1 contract while staying inside your limit (1.875 rounds down, always down).
Wider stop, smaller size.
That’s the mechanism that keeps a bad day from becoming a bad quarter.
Micro contracts make this workable for smaller accounts. MES has a tick value of $1.25, one-tenth of ES, which lets a $10,000 account size positions with real precision instead of being forced into all-or-nothing single-contract decisions.
Margin Types You Need to Know
Margin is a performance bond, not the amount you can lose. Confusing the two is the most expensive misunderstanding in retail futures.
| Concept | What it means | Example (1 ES contract at 5,500) | Why it matters |
|---|---|---|---|
| Notional value | Full contract value controlled | 5,500 × $50 = $275,000 | This is your true market exposure, not your margin |
| Initial margin | Exchange-set deposit to open a position overnight | Roughly $12,000 to $16,000 | Set by the exchange and raised during volatility spikes |
| Maintenance margin | Minimum equity to keep the position open | Roughly 90% of initial margin | Fall below it and you get a margin call or forced liquidation |
| Day-trade margin | Broker-set intraday requirement | As low as $500 per contract | Broker discretion, not exchange rule; can change without notice |
| Capital at risk | Stop distance × tick value × contracts | 10 ticks × $12.50 × 3 = $375 | The only number your position sizing should use |
Notice the spread.
A $500 day-trade margin lets you control $275,000 of index exposure, and a 2% adverse move against that notional is $5,500.
Ten times your margin deposit.
Leverage does not care about your win rate.
On risk per trade, the widely used guideline is 0.5% to 1% of account equity per position, with a daily stop of two to three times that.
At 1% per trade with a 2R target and a 45% win rate, a bad run of six losses costs 6% of the account.
Painful.
Survivable.
At 5% per trade, the same run costs 30%, and you now need a 43% gain just to get back to flat.
Costs deserve explicit modeling.
Round-turn commissions of $4 plus average slippage of one tick ($12.50 on ES) means each trade starts $16.50 in the hole per contract. Across 200 trades a year at 3 contracts, that’s roughly $9,900.
If your gross edge is $15,000, you just gave away two-thirds of it.
And if you hold overnight, initial margin applies rather than day-trade margin. Traders who size using $500 intraday margin and then decide to “let it run” overnight discover the requirement jumped 25-fold at 5:00 p.m. ET.
Does It Actually Work? Measuring Edge Honestly
Win rate is the most quoted and least useful statistic in trading.
A strategy that wins 70% of the time can lose money steadily. One that wins 40% can compound beautifully.
The variable that decides it is payoff size.
Expectancy, Profit Factor, and Sample Size
Trade expectancy is the average dollar outcome per trade: (win rate × average win) minus (loss rate × average loss).
Run two systems.
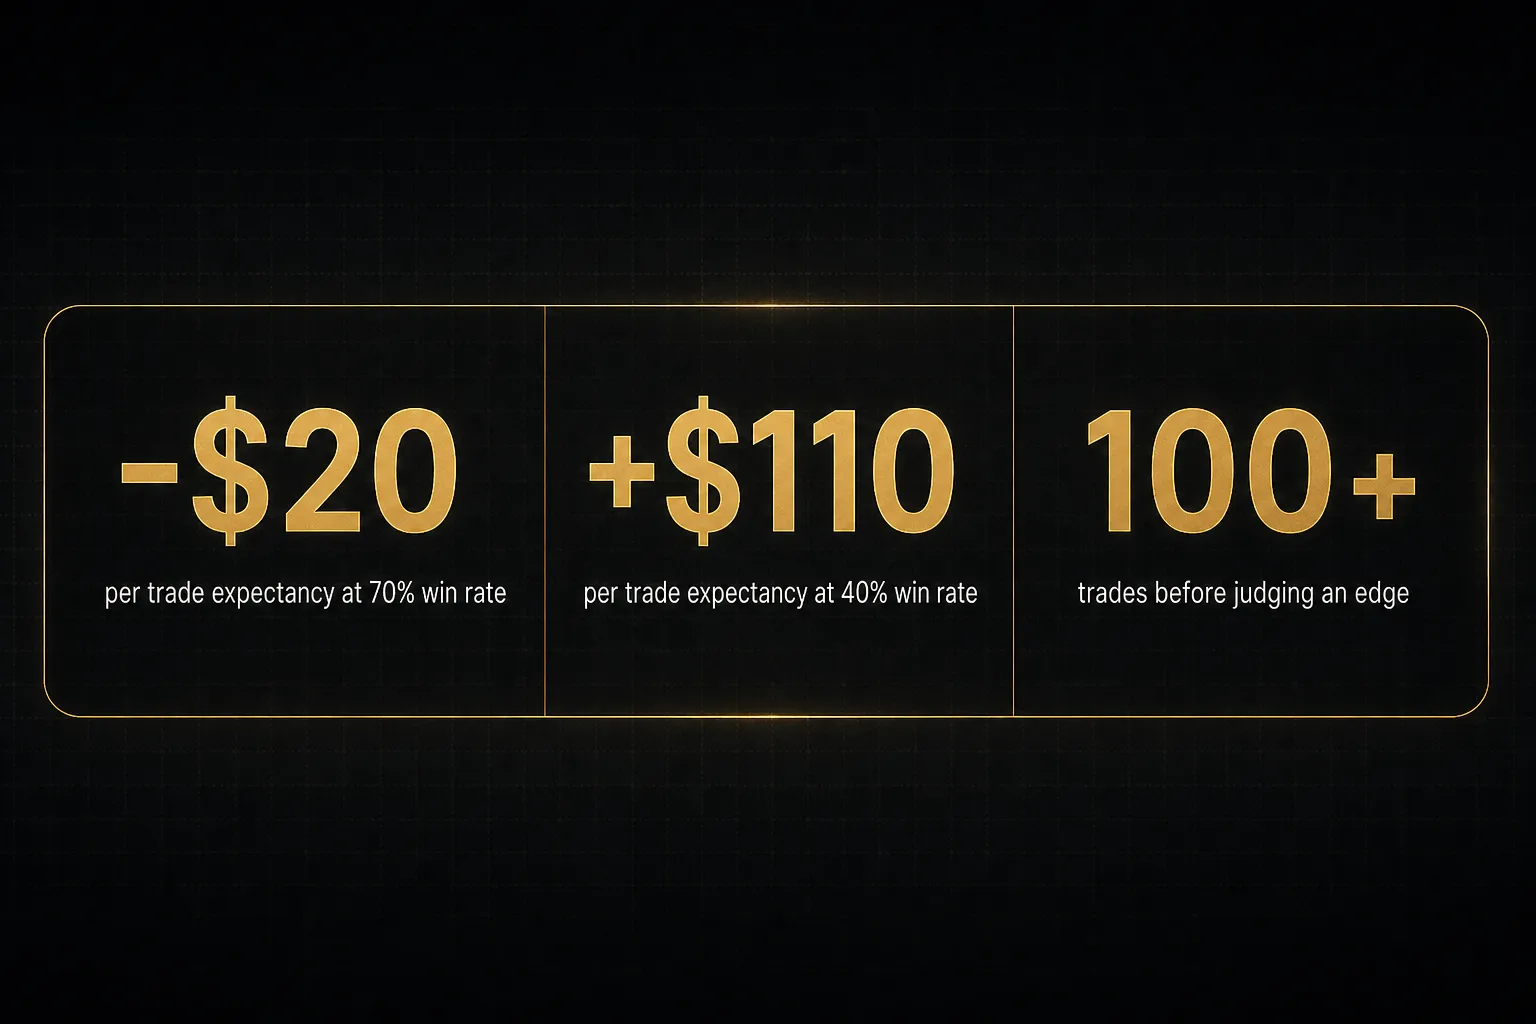
System A wins 70% of trades with an average win of $100 and an average loss of $300. Expectancy: (0.70 × $100) − (0.30 × $300) = $70 − $90 = negative $20 per trade.
Seventy percent accuracy, losing money.
System B wins 40% with an average win of $500 and an average loss of $150. Expectancy: (0.40 × $500) − (0.60 × $150) = $200 − $90 = positive $110 per trade.
Lower accuracy, five times the profitability per trade in absolute terms.
Profit factor (gross profit divided by gross loss) is the companion metric. Above 1.5 is solid for a discretionary intraday strategy. Above 2.0 in a backtest usually means you’ve over-fitted something, so check your assumptions before celebrating.
Maximum drawdown is the metric that determines whether you’ll still be trading the system when it works. A strategy with a 40% peak-to-trough drawdown is mathematically fine and psychologically unbearable for most people at real size.
On sample size: 100 trades is the common minimum before drawing conclusions, and 200 to 300 is better for strategies with win rates near 40%.
Below 30 trades, you’re measuring variance.
A 45% win-rate system will produce five consecutive losses roughly once every 60 trades purely by chance.
Why Backtests Fail Live
A clean equity curve on historical data is easy to produce and easy to fool yourself with. The failure modes are well known and consistently ignored.
Look-ahead bias is the classic: your rule uses the session high to define an entry that supposedly triggered at 10:15 a.m., but the session high wasn’t known until 3:00 p.m. Any rule referencing a completed bar’s data must only act on the next bar.
Contract-roll adjustment is unique to futures and quietly distorts results. Back-adjusted continuous contracts shift historical prices, which means your backtested support levels and percentage returns may never have existed at those prices.
Test roll logic explicitly.
Unrealistic fills assume you got the limit price every time and the stop filled exactly at your level. In practice, stops in fast markets slip, and limit orders at the extreme of a move often don’t fill at all, which removes your best trades and keeps your worst.
Over-optimization is the seductive one.
Tune four parameters across a decade of data and you’ll find a combination that looks extraordinary.
It’s describing history, not predicting it.
Walk-forward testing is the antidote: optimize on one window, test on the next untouched window, roll forward, and only trust results from the out-of-sample segments.
Then there’s live degradation.
Execution latency, discretionary rule-breaking under stress, and shifting ATR volatility regimes all shave the edge. A system built on 2022’s volatility often behaves differently in a compressed 2026 range.
Psychology and Knowing When to Pause
Oversized positions are the root cause of most rule violations, not weak willpower.
When a trade risks 4% of the account, you feel every tick, so you exit at 0.6R because the anxiety is intolerable. Do that repeatedly and you’ve converted a 2R strategy into a 0.6R strategy while keeping the full-size losses.
The chain is predictable: oversized position leads to premature exit, premature exit leads to watching the trade hit target without you, that leads to re-entry at a worse price, which leads to a larger loss and revenge trading.
All of it starts at the sizing step.
Set a mechanical pause rule so the decision isn’t made while you’re tilted. A workable version: after five consecutive losses taken within your defined risk limits, stop trading live for the rest of the week and review the journal.
If every trade followed the rules, that’s normal variance and the strategy stays. If three of five broke rules, the problem is execution, not the system.
Abandon a strategy only when the out-of-sample data says so: expectancy negative over 100-plus rule-compliant trades, or the market regime the strategy depends on has visibly ended (ADX under 20 for weeks on a trend system, for example).
Those are different problems with different fixes.
Indicators as Context, Not Commands
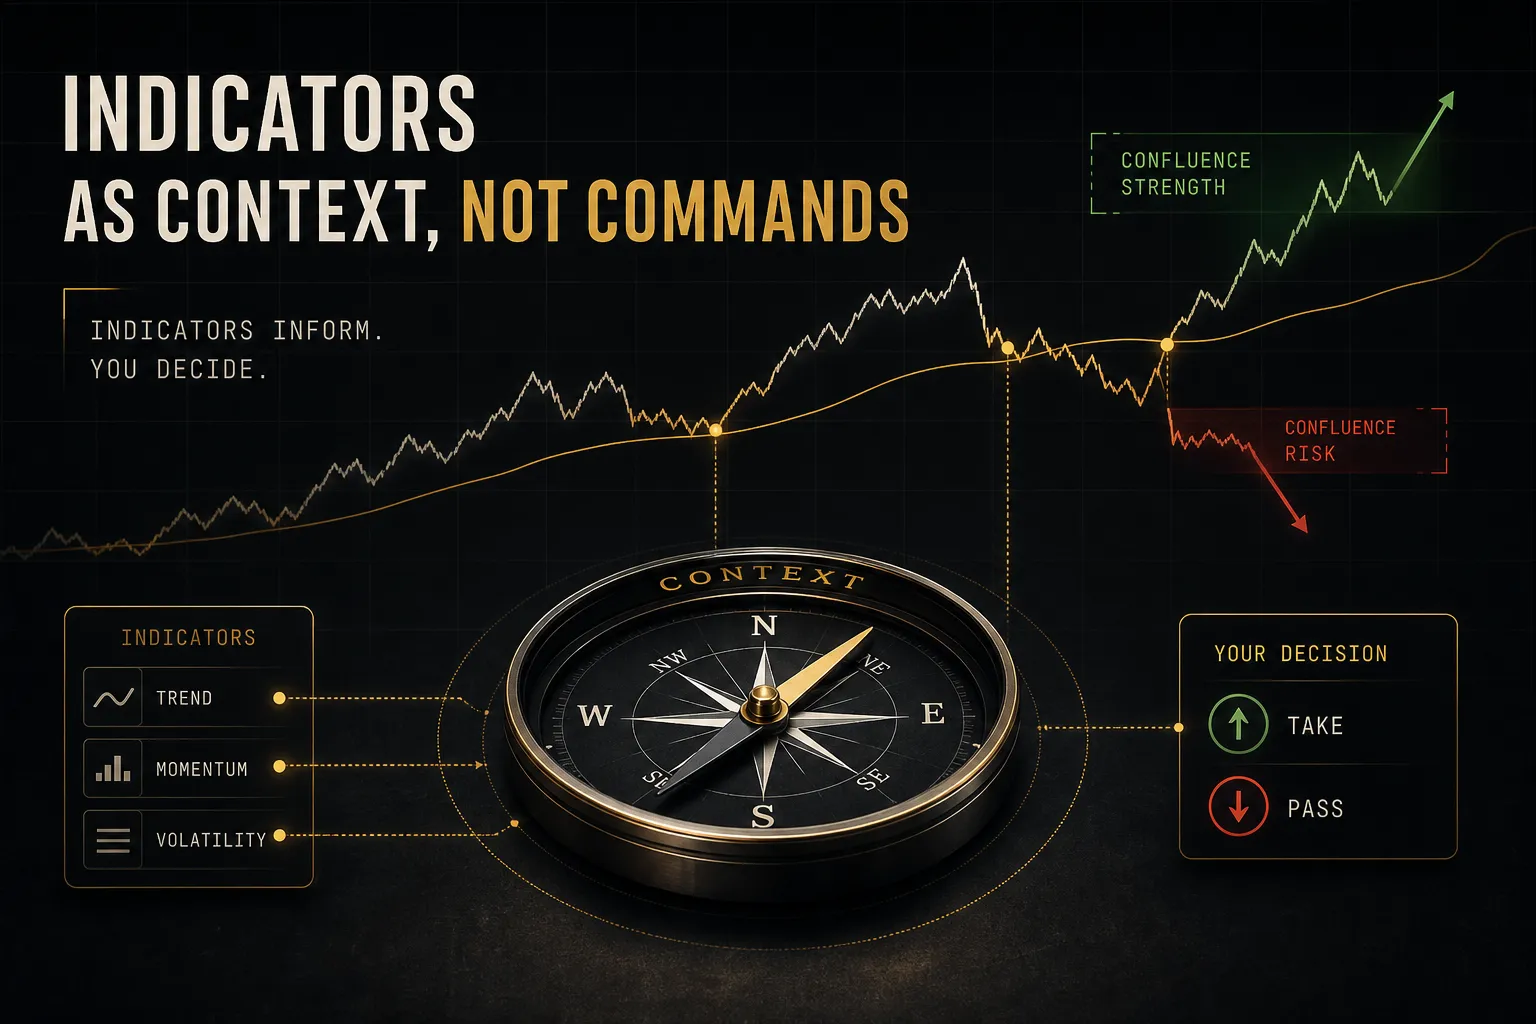
Every indicator you use is a transformation of price you already have. RSI, MACD, moving averages, ADX.
They compress past price into a single line, which makes them useful for reading context and useless as standalone entry triggers.
The failure pattern is universal: a trader takes a crossover signal on a 5-minute chart with no reference to higher-timeframe bias, no defined invalidation level, and no volatility check.
The signal is technically accurate.
The trade is still a coin flip with costs attached.
Build the process in layers instead, with each layer answering one question.
- Higher-timeframe bias: which direction am I permitted to trade today?
- Signal-based direction: does the trend read on my execution timeframe agree with that bias?
- Price-level entry: where exactly do I enter, based on structure such as VWAP, session highs and lows, or a supply and demand zone?
- Invalidation stop: what price proves the idea wrong, and what does that distance mean for my position size?
- No-trade conditions: what conditions (news windows, compressed ATR, conflicting timeframes) mean I sit out?
Direction and entry are separate decisions. Conflating them is why indicator-based trading gets a bad reputation.
Building Confirmation With PipTrend
PipTrend is a useful example of that separation built into a tool. Its color-coded trend signals answer the direction question only, telling you which side of the market you’re permitted to trade rather than shouting “enter now.”
The entry decision stays with price structure. Session highs and lows, VWAP, and marked supply and demand zones give you a specific level to work from, which also gives you a defined invalidation point and therefore a real position-sizing input.
Confirmation comes from its 12-timeframe confluence table.
When the shorter timeframes align with the higher ones, you have agreement across the structure; when they diverge, that divergence is itself an exit signal or a reason to skip.
The whipsaw filter targets the specific weakness of every trend tool, cutting false signals during choppy, low-directional conditions.
One more evaluation point worth applying to any signal service: PipTrend publishes a public results page with verified statements that include losing periods. Judge systems on documented outcomes with visible drawdowns, not on cherry-picked winners in a marketing carousel.
Common Futures Trading Questions
What is the most profitable futures trading strategy?
There isn’t one, and any source naming a single strategy is selling something. Profitability comes from matching the strategy to the current market regime, controlling risk per trade, and executing the same rules consistently across hundreds of trades.
Trend following tends to produce the largest gains during sustained directional periods, while mean reversion outperforms in range-bound conditions. The trader who switches appropriately beats the trader loyal to one label.
What is the easiest futures trading strategy for beginners?
A rules-based opening range breakout on a liquid contract like ES or MES is the most practical starting point. The range is objectively defined, the entry and stop levels are unambiguous, and the session window is fixed, which removes most discretionary decisions.
Trade it in micro contracts while you build a sample of 50 to 100 trades. Easy to define does not mean easy to profit from, but it does mean you can measure your execution accurately.
Can you make $100 a day trading futures?
It’s achievable, but setting it as a fixed daily target is a mistake that damages results. Markets don’t distribute opportunity evenly, so a fixed dollar goal pushes you to force trades on quiet days and to oversize when you’re behind.
The math also depends on your account.
Earning $100 daily on a $5,000 account means roughly a 2% daily return, which is unsustainable at responsible position sizing. Measure performance in R multiples over a month, not dollars per day.
What indicators are best for futures trading?
The most useful combination is one trend filter, one volatility measure, and one volume-based reference level: ADX for regime, ATR for stop placement and sizing, and VWAP for intraday value. That set covers direction, risk, and entry location without redundancy.
Adding a fourth or fifth oscillator typically adds correlation, not information. Indicators define context; price structure defines the entry.
How much money do you need to start trading futures?
Practically, $5,000 to $10,000 for micro contracts and $25,000 or more for standard E-mini contracts traded responsibly. Brokers may allow day-trade margins near $500 per contract, but that figure has no relationship to prudent risk.
Work backwards from the sizing formula instead.
If risking 1% per trade with a 10-tick ES stop means $125 of risk per contract, a $12,500 account supports exactly one contract. Anything less and you’re either overleveraged or should be trading micros.
Is futures trading better for day trading or swing trading?
Futures suit both, and the right choice depends on your schedule, your contract’s liquidity, and current volatility. Day trading requires screen presence during the highest-liquidity sessions, typically the New York open for equity index contracts, and it avoids overnight margin requirements entirely.
Swing trading demands wider stops, therefore smaller positions, plus tolerance for overnight gap risk and higher initial margin. If you can’t watch the 9:30 a.m. to noon window consistently, swing rules on daily charts will suit you far better than forcing intraday setups.
Pick One Strategy and Test It Properly
Choose one strategy.
Just one.
Pick the family that matches the current regime and the sessions your schedule allows, then write the complete rule set: market, session window, regime filter, trigger, entry, stop, target, size, and no-trade conditions.
Then track 30 to 50 trades in a journal before forming any opinion, and 100 before making a judgment call on the edge. Record the setup, the R multiple, whether you followed the rules, and the market condition.
Trade journaling is what converts random experience into measurable data.
The decision logic compresses into one line: trending market plus liquid session equals trend and breakout rules, range-bound market equals mean-reversion rules with tight invalidation.
The strategy name on the label matters far less than most traders believe. Consistent execution and disciplined risk control decide the outcome… and those are entirely within your control, whichever method you choose.
Sources
Risk Disclaimer: Trading involves risk. Past performance doesn't guarantee future results. Only trade with money you can afford to lose. PipTrend is a tool to assist your trading decisions, not financial advice.