ICT Trading Strategy Explained for Skeptical Traders
On this page
ICT Trading Strategy Explained for Skeptical Traders
ICT Trading Strategy Explained for Skeptical Traders
What Is ICT Trading, Really?
Search “ICT trading strategy” and you’ll find thousands of chart screenshots where price does exactly what the arrow says it will.
Perfect entries. Clean targets. Zero losses.
That’s the problem.
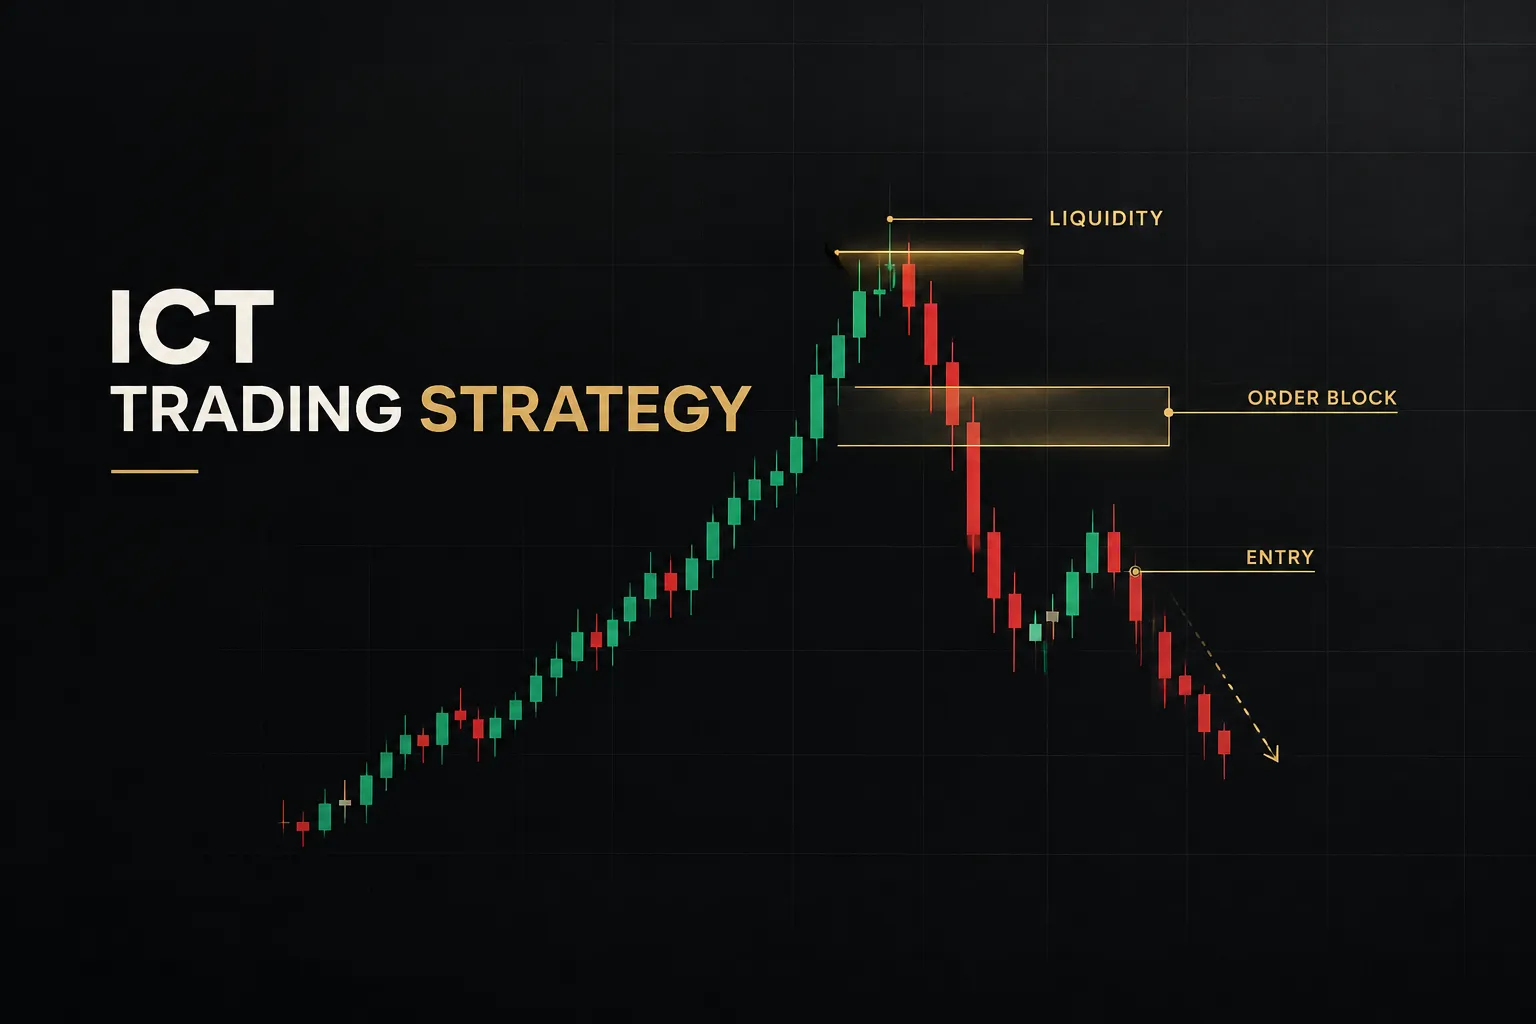
ICT refers to a collection of price-action concepts popularized by Michael J. Huddleston, who trades under the name Inner Circle Trader. The framework centers on a handful of ideas: liquidity, market structure, fair value gaps, order blocks, and session timing windows known as kill zones.
Here’s what most tutorials skip.
ICT is not a single strategy with one rulebook. It’s a discretionary framework assembled from dozens of separate models, each with its own conditions, and Huddleston has taught many variations over the years.
Two traders can both claim to trade “ICT” and share almost nothing in common.
That flexibility is exactly why the concepts are so easy to abuse. Draw enough boxes on a chart after the fact and something will always line up with where price went.
A framework that explains every move in hindsight explains nothing in advance. The test is whether you can write the rule down before the candle prints.
This guide takes a different angle. Instead of showing you perfect setups, it converts ICT concepts into definitions you can test, with explicit invalidation rules attached to each one.
If a concept can’t be invalidated, it can’t be backtested, and if it can’t be backtested, you have no idea whether it works.
The core problem here is distinguishing genuine confluence from subjective chart labeling.
Real confluence means independent conditions agreeing. Subjective labeling means moving your definitions until the chart cooperates.
By the end, you’ll have a defined vocabulary, a repeatable process, a backtesting protocol, and a clear list of conditions where you should stay flat. Whether ICT produces an edge for you is something only your own tested data can answer.
The Building Blocks of ICT
Every ICT model is built from the same four primitives. Get the definitions loose and everything downstream becomes guesswork.
Liquidity and Liquidity Sweeps
Forget the narrative about banks hunting your stop loss personally. Liquidity, in market-microstructure terms, simply describes clusters of resting orders at price levels where many participants have placed similar instructions.
Swing highs attract buy stops from short sellers and buy stop entries from breakout traders. Swing lows attract sell stops from longs and sell stop entries from breakdown traders.
Those clusters are what ICT calls a liquidity pool.
The terminology splits by direction. Buy-side liquidity sits above highs (orders that buy when triggered). Sell-side liquidity sits below lows.
Price tends to gravitate toward these zones for a mundane reason: that’s where volume is available to fill large orders without excessive slippage.
No conspiracy required.
The concept of draw on liquidity follows from this. If the nearest meaningful pool of resting orders is above current price, that’s the more probable short-term magnet.
Now the part that actually matters for trading: telling a liquidity sweep from a genuine breakout.
- Sweep: price wicks beyond the prior swing point and closes back inside the range, typically within one to three candles on your execution timeframe, followed by a retracement of at least 50% of the sweep’s extension.
- Breakout: price closes beyond the swing point and the next candle extends further in the same direction, with no return inside the prior range.
Write the invalidation down explicitly. If price closes beyond the swept level and the following candle makes a new extreme in that direction, the sweep thesis is dead.
Not “probably weakening.”
Dead.
Exit or stand aside.
Without that rule, every failed sweep becomes “a deeper sweep,” and you will hold losers forever.
Market Structure Shifts Explained
Market structure is the sequence of swing highs and lows that defines trend direction.
Two events matter.
A break of structure (BOS) occurs when price closes beyond the most recent swing high in an uptrend, or below the most recent swing low in a downtrend.
It signals continuation.
The trend did what trends do.
A change of character (CHoCH) is the first failure of that pattern. In an uptrend, it’s the first close below the swing low that preceded the most recent high.
It signals a potential reversal, not a confirmed one.
Here’s where most traders get sloppy.
“Swing high” means nothing without a defined lookback. Use a fixed fractal rule: a swing high is a candle whose high exceeds the highs of the three candles before it and the three after it.
Three and three.
Same on both sides.
Apply that rule mechanically and your structure reads the same way every time.
Eyeball it and you’ll find whatever structure supports the trade you already want.
One more distinction worth enforcing: market structure shift should require a candle body close beyond the level, not a wick. Wick-based structure breaks generate a flood of false signals, particularly on timeframes below 15 minutes.
Fair Value Gaps and Order Blocks
A fair value gap (FVG) is a three-candle pattern where the wick of candle one and the wick of candle three fail to overlap, leaving an unfilled price range in the middle. In a bullish FVG, candle one’s high sits below candle three’s low. That untraded space is sometimes called a liquidity void.
The logic: price moved so fast that one side never got filled. Markets often return to that zone before continuing.
An order block is the last opposing candle before a strong directional move. Last down candle before a sharp rally equals bullish order block. Last up candle before a sharp selloff equals bearish order block.
A breaker block is an order block that failed and then held as support or resistance from the opposite side.
Both definitions depend on the word “strong.”
That word does all the work, and nobody defines it.
Use displacement with a numeric threshold instead. A move qualifies as displacement when the candle’s range exceeds 1.5 times the 14-period ATR on that timeframe, and the body accounts for at least 60% of the total range.
Below that, you’re looking at ordinary volatility wearing a costume.
Two additional filters before you trust any displacement candle:
- News check: if the candle coincides with a scheduled release (CPI, NFP, central bank decision), the move reflects information shock, not order flow structure. Treat the resulting zones with suspicion.
- Spread check: abnormally wide spreads during rollover or thin sessions can manufacture fake gaps on your broker’s feed that don’t exist elsewhere.
Mitigation and invalidation rules, written plainly:
- An FVG is partially mitigated when price trades into it, and fully mitigated when price trades through its full range.
- An FVG is invalidated when a candle closes fully beyond the far edge of the gap. The zone is done. Remove it from the chart.
- An order block is invalidated when a candle body closes beyond the opposite extreme of the block. Not a wick through it. A close beyond it.
These rules will occasionally cost you a trade that would have worked.
Accept that.
The alternative is an infinitely elastic definition, and elastic definitions cannot be tested.
Turning ICT Into a Repeatable Process
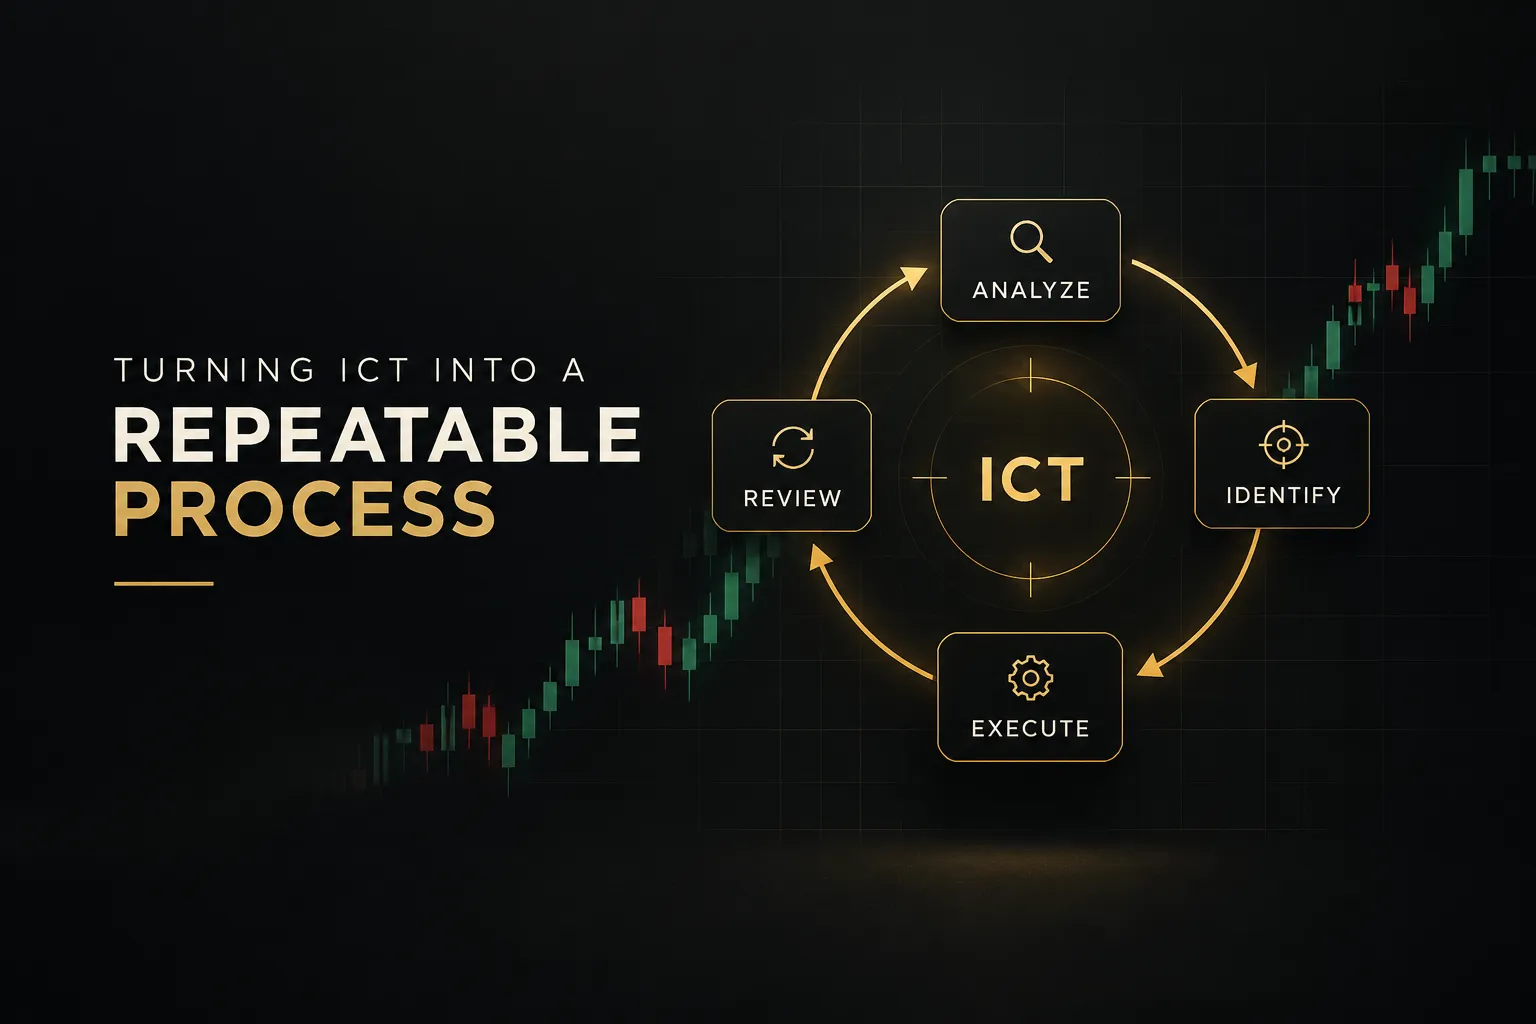
Concepts are useless until they’re sequenced. The following workflow runs top-down, from bias to execution, with a conflict-resolution rule at every stage.
Setting Your Daily Bias
- Mark the daily trend first. Using the three-and-three fractal rule, label the last four swing points on the daily chart. Higher highs and higher lows equal bullish bias. Lower highs and lower lows equal bearish. Mixed equals no bias, and no bias means no trade.
- Plot the dealing range. Identify the most recent significant swing high and swing low on the 4H chart. That’s your dealing range. The midpoint (the 50% level) separates premium from discount. You look for longs only in discount, shorts only in premium.
- Add prior day high and low. These are the two most reliable liquidity pools on any intraday chart. Mark them every session. They define your likely draw on liquidity.
- Resolve timeframe conflicts with a strict hierarchy. Daily beats 4H. 4H beats 1H. If the daily is bullish and the 4H is bearish, you either wait for 4H alignment or skip the day entirely. The lower timeframe never overrides the higher one.
- Write the bias down before the session opens. One sentence: direction, target liquidity, invalidation level. If you can’t write it, you don’t have it.
Kill Zones and Timing
- Use New York time as your single reference clock. The London kill zone runs 02:00 to 05:00 NY. The New York kill zone (AM) runs 08:30 to 11:00 NY. New York PM runs 13:30 to 16:00. The Asian range is 20:00 to 00:00 NY.
- Account for daylight saving drift. The US and Europe change clocks on different dates, creating a two to three week window each spring and autumn where London and New York overlap shifts by an hour. Your kill zone windows move with it.
- Verify your broker’s server time. Many MT4/MT5 servers run GMT+2 or GMT+3, which means your daily candle closes at 17:00 NY, not midnight. This changes where your daily highs and lows sit. Check it once, note the offset, and convert every time.
- Adjust windows by instrument. Forex majors respond to London and NY sessions. Index futures concentrate around the 09:30 NY cash open. Crypto trades 24/7, so session logic is weaker, though the NY AM window still shows elevated volatility on BTC and ETH.
- Understand the Power of Three framing. The Power of Three describes an accumulation phase, a manipulation move (often a sweep against the eventual direction), and a distribution leg. It’s a lens for reading a session, not a signal in itself.
Entries, Stops, and Targets
- Wait for the sweep, then the shift. Your entry sequence is: price sweeps a liquidity pool, then produces a market structure shift with displacement on your execution timeframe (typically 5M or 15M). No shift, no trade.
- Enter at the FVG or order block left by the displacement. The optimal trade entry zone in ICT terms is the 62% to 79% retracement of the displacement leg. Where an FVG overlaps that band, you have genuine confluence.
- Place the stop beyond the sweep extreme, plus a buffer. Add the instrument’s typical spread plus a slippage allowance. On EURUSD that might be 2 to 3 pips. On indices, it may be several points. A stop placed exactly at the wick tip gets taken out by noise.
- Target the opposing liquidity pool. If you entered long after a sweep of sell-side liquidity, your target is the nearest untouched buy-side pool: prior day high, session high, or an unmitigated FVG above.
- Size the position from stop distance, not from conviction. Risk a fixed percentage (0.5% to 1% is standard). Position size equals risk amount divided by stop distance in currency terms. Wider stop, smaller size. Always.
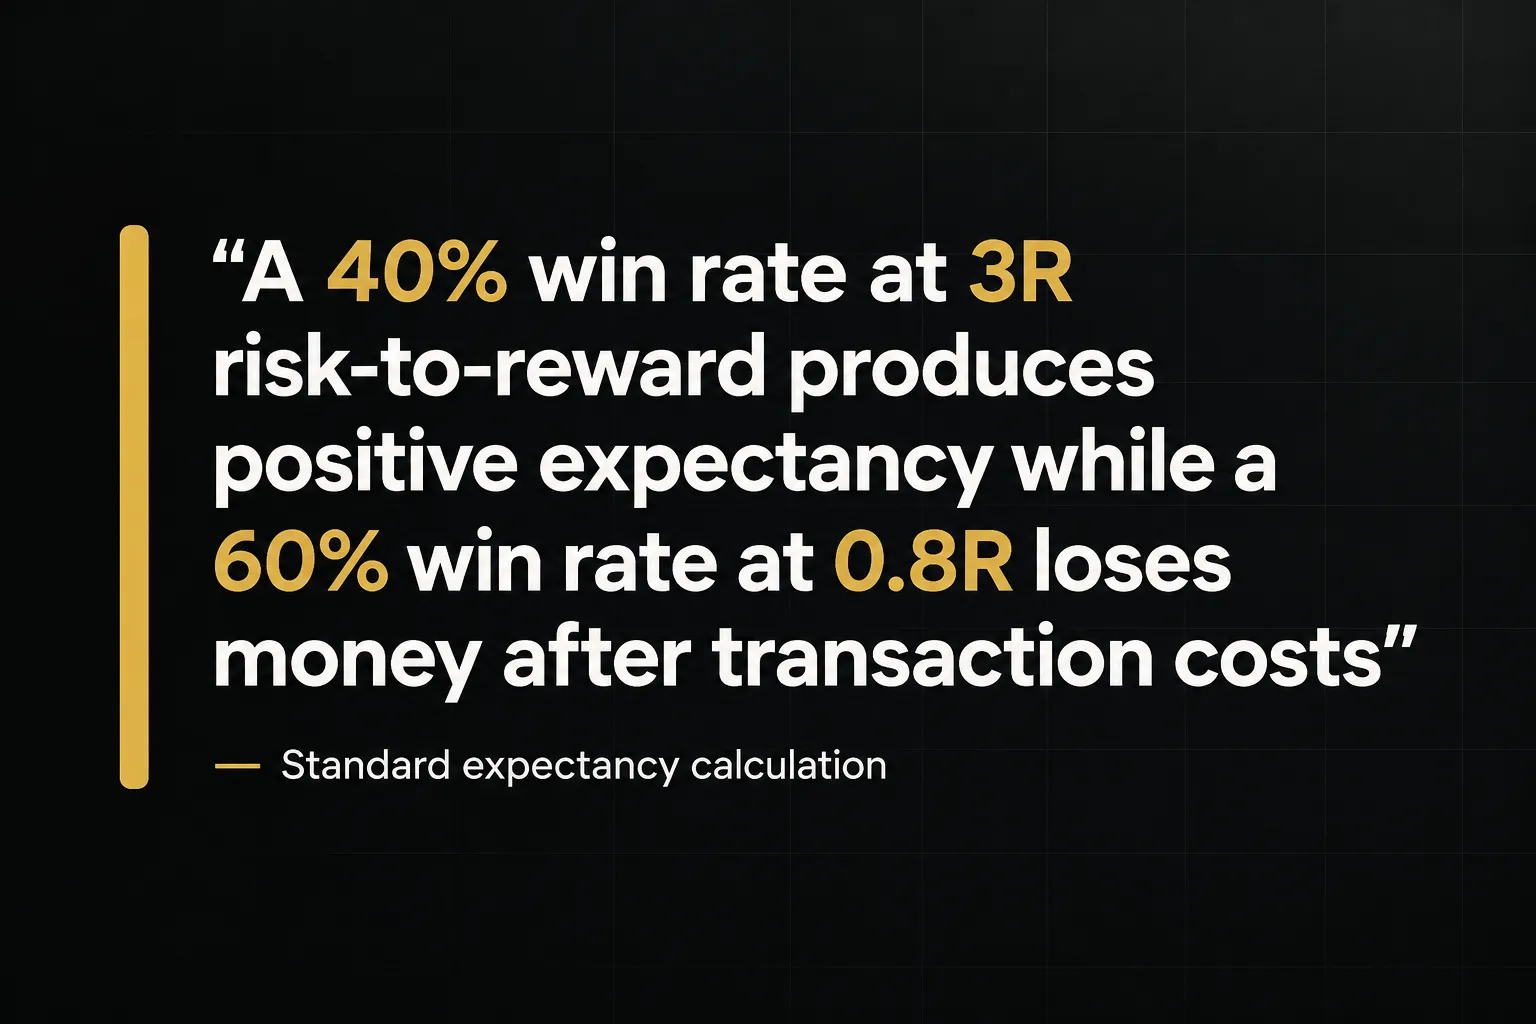
- Calculate expectancy before you trust the setup. Trade expectancy equals (win rate x average win) minus (loss rate x average loss), net of spread and commission. A 40% win rate at 3R is profitable. A 60% win rate at 0.8R, after costs, is not.
Testing ICT Before You Trade It
Most traders “backtest” by scrolling back through a chart and nodding at setups that worked.
That’s not testing.
That’s confirmation bias with extra steps.
A Backtesting Protocol That Works
Write your setup criteria before you open a single chart. Every condition, numerically specified: displacement threshold, swing lookback, kill zone window, stop buffer, target rule.
If a criterion requires judgment, define the judgment.
Then collect a sample.
A minimum of 100 trades is the floor, not the goal. Below that, random variation swamps signal.
A strategy with a true 45% win rate can easily produce 60% or 30% over 30 trades.
The single most important technique is hiding the right side of the chart. Use a replay tool that reveals candles one at a time, or physically cover the screen.
Look-ahead bias is invisible to the person committing it, which is precisely what makes it so destructive.
Screenshot every setup at the moment of entry, before the outcome is known. Log the entry, stop, target, and reason.
Then log the result separately.
This creates an audit trail you cannot retroactively edit in your memory.
Split your data.
Use the first 60% of your sample period as in-sample data for developing rules, and hold back the final 40% as out-of-sample for validation.
If performance collapses out-of-sample, you curve-fitted. That happens more often than anyone admits.
Apply realistic costs.
Add your broker’s average spread plus 0.5 pips of slippage to every entry and exit.
On a strategy averaging 15 pips of profit per trade, transaction costs of 2 pips consume roughly 13% of gross returns.
When Not to Trade
Knowing when to stay flat protects more capital than any entry refinement. Skip the session entirely under these conditions:
- Within 30 minutes of a high-impact release. CPI, NFP, FOMC, and central bank rate decisions produce displacement that has nothing to do with structure. Spreads widen, slippage spikes, and your stop buffer becomes irrelevant.
- When spreads exceed twice their session average. Check before entry, not after. Wide spreads turn a 1:3 setup into a 1:2 setup silently.
- Holiday and low-liquidity sessions. Christmas week, Thanksgiving Friday, Japanese Golden Week. Thin books produce erratic wicks that trigger false sweeps.
- When higher-timeframe bias is unclear. Mixed daily structure means you’re guessing. Guessing with leverage is expensive.
- When two signals conflict at the same level. A bullish order block sitting inside a bearish FVG is not confluence. It’s noise. Wait for a cleaner picture.
One structural issue deserves special attention: spot forex is decentralized.
There is no single consolidated tape.
Your broker’s feed aggregates a specific set of liquidity providers, and another broker’s feed aggregates a different set.
The practical consequence is that wick extremes can differ by one to three pips between feeds. That’s enough to shift an FVG boundary, change whether a sweep “counted,” and move your stop into or out of harm’s way.
Backtest on the same feed you trade on.
Results from a different data source are indicative at best.
Can an Indicator Spot ICT Setups?
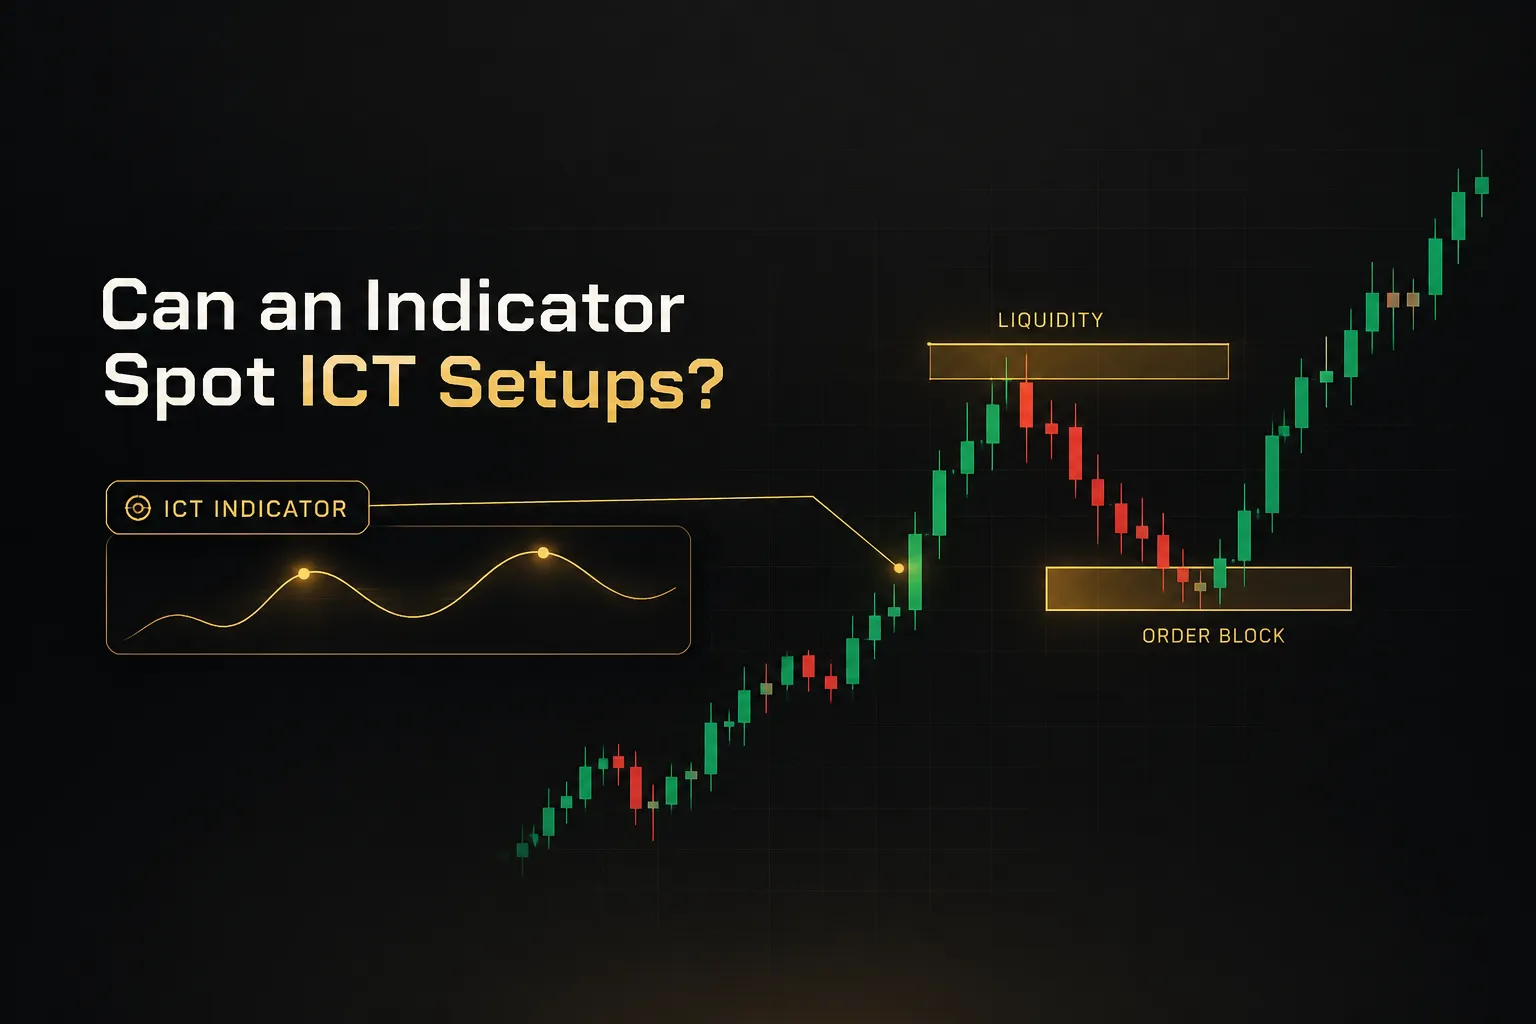
Software can label an FVG faster than you can.
Whether it should be trusted to is a different question.
Three failure modes matter.
Repainting is the first: an indicator marks a structure break intrabar, then removes the label when the candle closes elsewhere.
Your backtest shows signals that never actually existed in real time.
The second is confirmation timing.
An order block detected at candle close is a different signal than one detected mid-candle. Automated tools frequently blur this distinction, and the performance difference between the two can be substantial.
The third is feed dependence.
Because wick-based levels vary between brokers, an indicator running on one data source will flag zones that a second source never produces.
Same code, different signals.
So what’s automation actually good for?
Organization.
A tool like PipTrend handles the mechanical parts well: a multi-timeframe table showing trend alignment across daily, 4H, 1H, and lower charts, session kill zone highlighting so you’re not converting timezones manually, and automated fair value gap and supply-demand zone detection.
That’s a filtering layer, not a decision layer.
The distinction matters enormously.
A signal tells you a direction is worth investigating. Your entry still comes from price levels you marked yourself, validated against the invalidation rules you defined earlier.
Automation narrows the search.
It doesn’t replace the judgment.
Treat every automated signal as a question, not an answer. The question is “does this match my written criteria?” If you can’t answer it independently, don’t take the trade.
Transparency is the due-diligence standard worth demanding from any signal provider. PipTrend publishes trade ideas with verified outcomes, including the losing ones.
That’s the baseline.
Any tool showing only winners is marketing, not performance data, and you should treat the omission as the most informative thing about it.
ICT Trading FAQ
What is the ICT strategy in trading?
ICT is a discretionary price-action framework built around liquidity, market structure, and session timing, popularized by Michael J. Huddleston under the name Inner Circle Trader. It teaches that price moves toward pools of resting orders above swing highs and below swing lows, and that traders can position after those pools are swept.
The core components are liquidity sweeps, break of structure and change of character, fair value gaps, order blocks, and kill zone timing windows.
There is no single ICT strategy, only a shared vocabulary and dozens of model variations.
Is ICT trading good for beginners?
No, not as a starting point.
ICT requires simultaneous reading of multiple timeframes, subjective structure identification, and precise session timing, which is a heavy cognitive load for someone still learning order types and position sizing.
The bigger risk is that ICT’s flexibility lets beginners rationalize any trade after the fact.
If you’re new, master risk management and a single mechanical setup first. Then add ICT concepts one at a time, testing each addition.
What is the success rate of ICT trading?
No verified win-rate statistic for ICT exists publicly. Claims of 70%, 80%, or 90% win rates circulate widely on social media and none are supported by audited, independently verified track records.
This is the wrong metric anyway.
Profitability comes from expectancy, which combines win rate, average risk-to-reward ratio, and transaction costs.
A trader running 40% wins at 3R outperforms one running 65% wins at 0.7R.
Your results depend on your execution and risk model, not on the label “ICT.”
What is the best ICT strategy?
The best ICT strategy is the narrowest one you’ve personally tested to 100+ trades with positive out-of-sample expectancy. For most traders, that means a liquidity sweep followed by a market structure shift, with entry at an overlapping fair value gap, traded in one session on one instrument.
Adding models does not add edge.
It adds variables, which makes attribution impossible when performance changes.
What is the difference between smart money concepts and ICT?
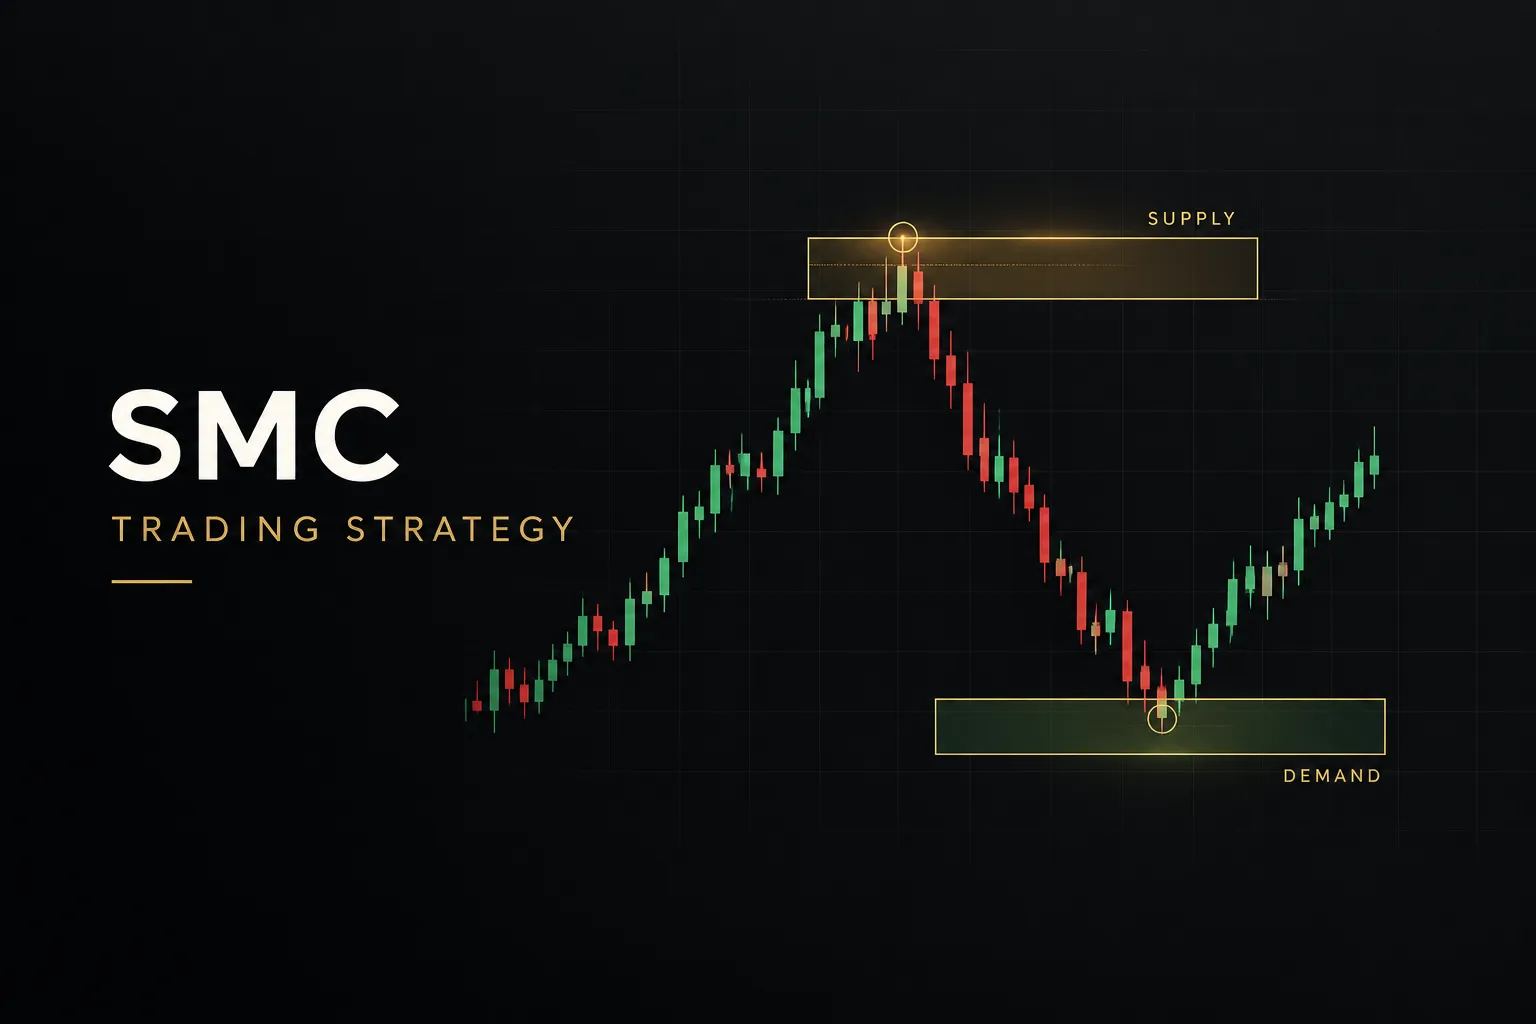
Smart money concepts (SMC) is a related but narrower branch focused primarily on institutional order flow, market structure, and supply-demand zones. ICT is broader, adding session-based models, kill zone timing, Power of Three, premium and discount within a dealing range, and a considerably larger proprietary vocabulary.
Significant overlap exists.
Order blocks, fair value gaps, and liquidity sweeps appear in both.
In practice, SMC is often described as a simplified derivative of ICT’s structural teachings, minus the session-timing layer.
How do you trade an ICT fair value gap?
You wait for price to return to the gap after a displacement move, then enter in the direction of that displacement with a stop beyond the gap’s far edge. The FVG is identified as a three-candle pattern where candle one’s wick and candle three’s wick do not overlap.
Apply the mitigation rules strictly. Partial mitigation (price entering the gap) is your entry trigger.
Full invalidation occurs when a candle closes completely beyond the far edge of the gap, at which point you exit and remove the zone from your chart.
Trading an FVG in isolation, without a prior liquidity sweep and a confirming structure shift, produces far more false signals than the setups you’ll see in tutorials.
Start Narrow, Then Expand
One recommendation, and it’s not the exciting one: pick a single market, a single session, a single setup, and a single risk model.
Trade only that for 100 trades.
Concretely, that might be EURUSD, London kill zone, liquidity sweep plus FVG and order block confluence, 0.5% risk per trade.
Nothing else.
No New York session “just this once.”
No indices because forex was quiet.
Here’s the decision rule that filters everything: if you cannot state your invalidation condition out loud before you click buy, the setup is not ready to trade live.
Not “I’ll manage it.”
A price level, defined in advance.
And the perspective shift that makes all of this worthwhile.
ICT concepts are a vocabulary for describing price behavior.
Fair value gaps, order blocks, kill zones, draw on liquidity… these are useful labels for patterns that genuinely appear in markets.
But a vocabulary is not evidence.
Naming a thing accurately doesn’t make it profitable.
The edge, if you find one, comes from documented rules you tested on data you couldn’t see the future of.
That’s the whole game.
Everything else is chart decoration.
Sources
Risk Disclaimer: Trading involves risk. Past performance doesn't guarantee future results. Only trade with money you can afford to lose. PipTrend is a tool to assist your trading decisions, not financial advice.