RSI divergence strategy: a rules-based trading playbook
On this page
Why most RSI divergence guides mislead traders
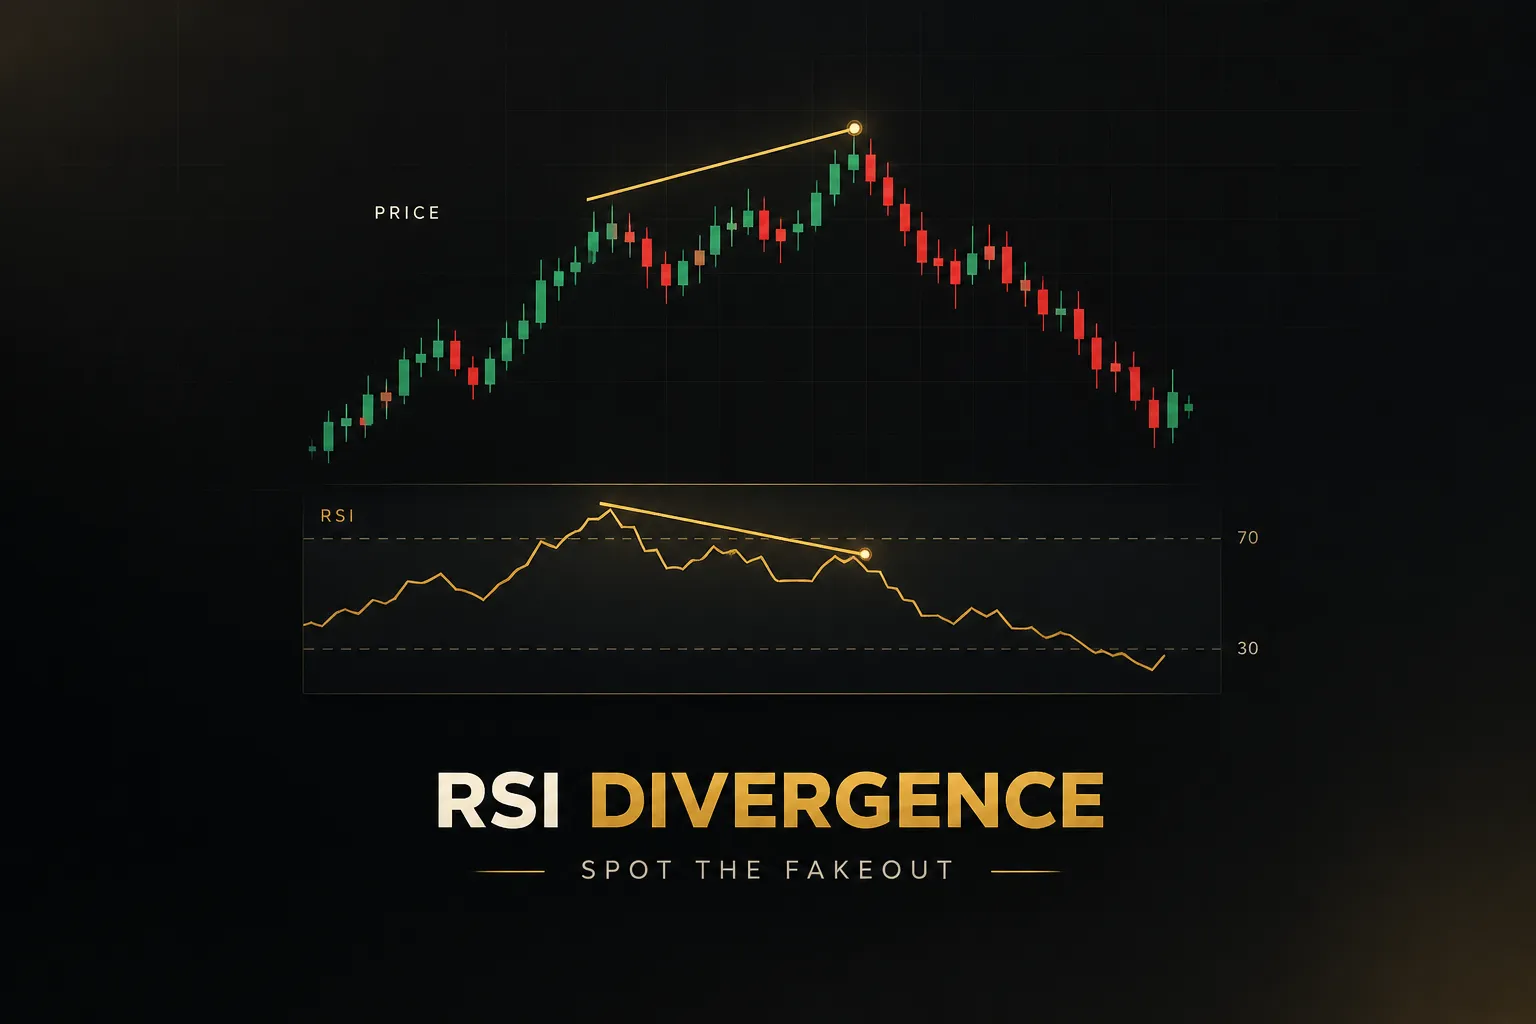
Open almost any RSI divergence tutorial and you will see the same chart. Price prints a higher high, the relative strength index prints a lower high, and the market collapses right on cue.
The author picked that chart after the move happened.
That is the core problem.
Divergence is a momentum warning, not an entry signal and not a reversal guarantee. It tells you the force behind a move is fading.
It says nothing about when, or whether, price will actually turn.
Most guides skip the hard part.
They show idealized hindsight charts instead of objective rules you could apply to a live chart with the right edge still forming. Ask two traders to mark divergence on the same screen and you will often get two different answers, which means the “strategy” is really just pattern-spotting with a confident caption.
This playbook takes a different route.
As of 2026, the tools for testing a rules-based RSI divergence strategy are cheap and widely available, so there is no excuse for trading on vibes. We will build the process in five layers:
Identification (objective swing points), confirmation (price action that adds new information), regime context (is the trend too strong to fade?), entries and exits (defined risk before you click), and backtesting (proof, not anecdotes).
One more preview. Later, you will see how multi-timeframe analysis turns a vague warning into a filtered trade decision. Checking higher-timeframe direction first removes a large share of the divergences that look great and then fail.
What RSI divergence actually measures
The RSI 14, introduced by J. Welles Wilder in his 1978 book New Concepts in Technical Trading Systems, compares the average size of up-closes to down-closes over 14 periods and scales the result from 0 to 100.
It is a momentum oscillator. It measures the speed of price change, not its direction.
Divergence happens when those two things disagree. Think of a car still climbing a hill after the driver eases off the accelerator: it keeps moving up, but each second it gains less ground.
Divergence spots the easing off.
It cannot tell you when the car stops.
Regular vs hidden divergence
Every divergence falls into one of two families. The difference is whether the signal argues against the current move or with the broader trend.
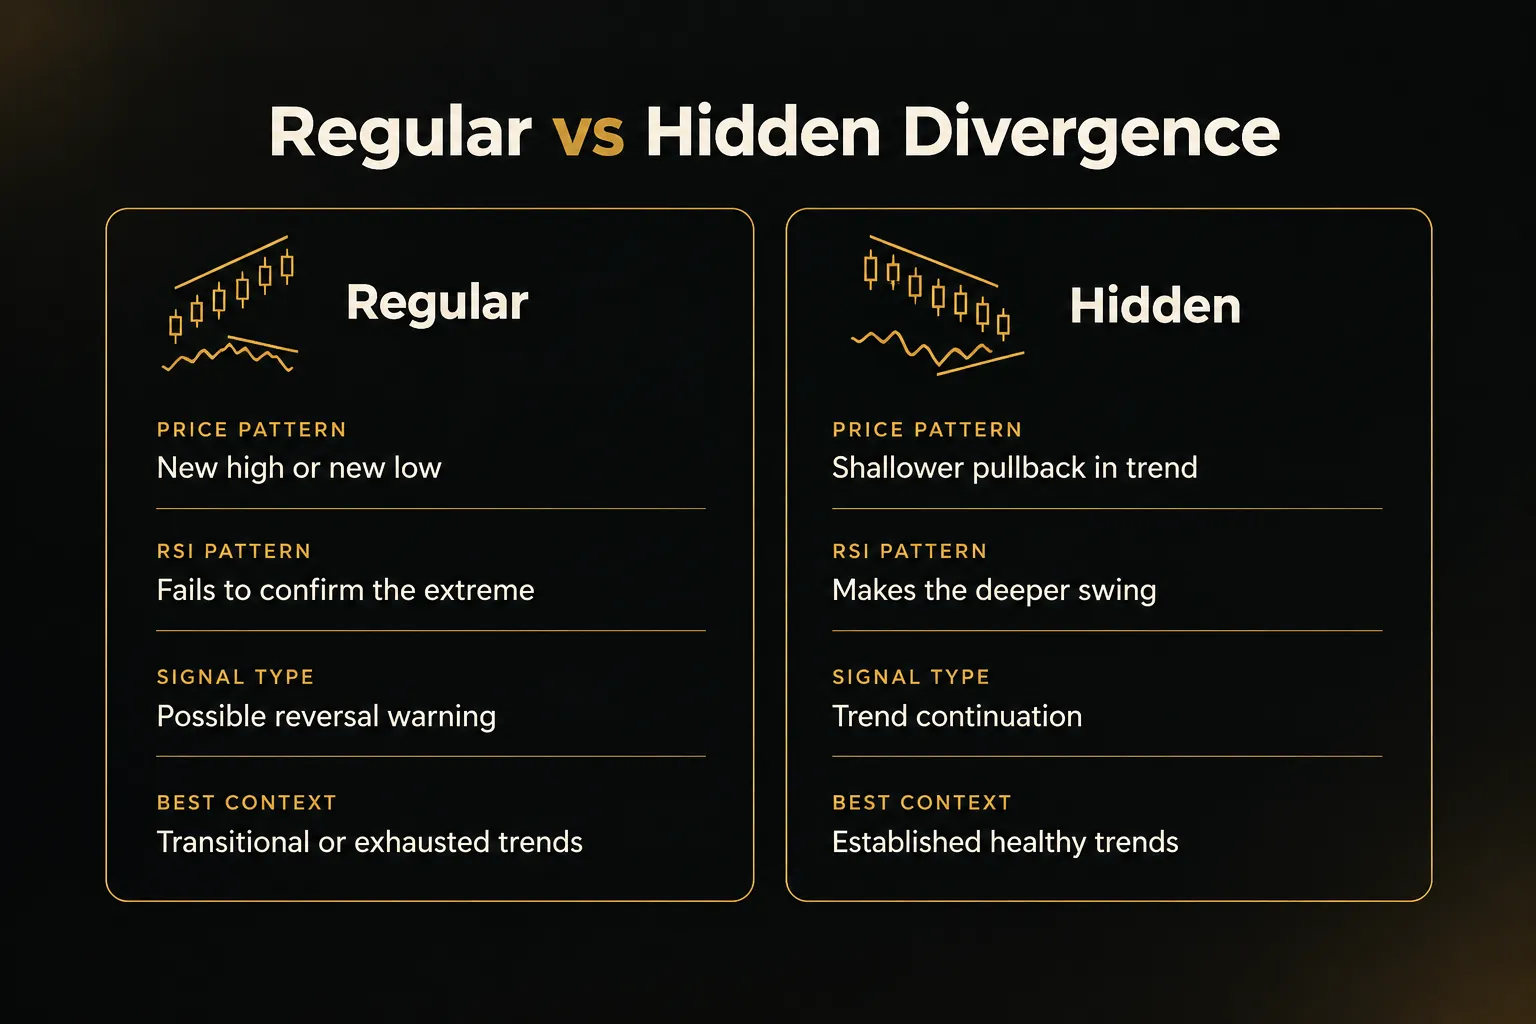
- Regular divergence appears when price makes a new extreme (a higher high or lower low) but RSI fails to confirm it. It is a potential reversal warning, because the latest push in price happened on weaker momentum than the push before it.
- Hidden divergence appears when price makes a shallower pullback (a higher low in an uptrend or a lower high in a downtrend) while RSI makes a deeper one. It is a trend-continuation signal, because momentum reset fully while price barely gave ground.
- Failure swings are Wilder’s original RSI pattern and are related but distinct. A bearish failure swing occurs when RSI tops above 70, pulls back, fails to make a new high, then breaks below its own prior trough, all judged on the indicator alone.
- Positive and negative reversals, a term popularized by RSI specialist Andrew Cardwell, describe what most traders now call hidden divergence. A positive reversal is bullish continuation; a negative reversal is bearish continuation.
Bullish vs bearish patterns
Combine the two families with the two directions and you get four setups. Each requires a specific swing high and swing low relationship between price and RSI.
- Regular bullish divergence: price makes a lower low, while RSI makes a higher low. Selling pressure is weakening at the extreme, which warns that a downtrend may be exhausting.
- Regular bearish divergence: price makes a higher high, while RSI makes a lower high. Buying momentum is fading at the top, which warns that an uptrend may be running out of fuel.
- Hidden bullish divergence: price makes a higher low, while RSI makes a lower low. The pullback flushed momentum hard, yet buyers defended a higher price, which favors continuation of the uptrend.
- Hidden bearish divergence: price makes a lower high, while RSI makes a higher high. Momentum bounced strongly, yet sellers capped price below the prior high, which favors continuation of the downtrend.
A useful memory hook: regular divergence compares the extremes of a move, while hidden divergence compares the pullbacks within a trend.
Mix those up and you will read continuation setups as reversals.
How to spot divergence without guessing
Here is a quick test of any divergence method: could a computer apply it? If the answer depends on “it looks like a swing high,” you do not have a rule.
You have an opinion, and opinions cannot be backtested.
The steps below convert divergence spotting into a repeatable checklist.
Choosing objective swing points
- Define pivot strength. A swing high is valid only if it has a set number of lower highs on each side, for example 5 bars left and 5 bars right. Shorter settings (3/3) produce more signals and more noise; longer settings (8/8) produce fewer, cleaner pivots.
- Set a lookback window. Compare only pivots that are between roughly 5 and 60 bars apart. Pivots closer than that are usually the same swing; pivots further apart belong to different market phases.
- Require a minimum RSI difference. Demand at least 2 to 3 RSI points between the two indicator pivots. A difference of 0.4 points is rounding error, not divergence.
- Add a zone condition. For regular bearish divergence, require the first RSI peak above 60; for regular bullish divergence, require the first trough below 40. This keeps you focused on exhausted moves rather than mid-range wobble.
Wicks, closes, or indicator values
- Pick one price source and never switch. Wicks capture the true extreme, while closes reflect where the market settled. Both work, but drawing the first pivot from a wick and the second from a close manufactures divergences that do not exist.
- Match your price source to the RSI input. Standard RSI is calculated on closing prices, so close-based price pivots align most cleanly with it. If you prefer wicks, accept that some “divergences” will simply reflect a long tail the RSI never saw.
- Use the RSI’s own pivot, not the RSI value at the price pivot. The indicator’s peak often lands one or two bars away from price’s peak. Allow a tolerance of about 2 bars between the two pivots, and measure the RSI swing on its own terms.
The confirmation lag problem
- Accept that pivots are confirmed late. With a 5/5 rule, a swing high only exists once 5 more bars have closed below it. On a 1-hour chart, that is five hours after the actual top.
- Check your indicator for repainting. Many automated divergence tools draw lines at the pivot bar but only after future candles confirm it, so historical charts look far more accurate than live trading. Use bar replay to watch when the signal truly appears.
- Price the delay into your plan. By the time a pivot confirms, price has already moved away from the extreme, so your stop beyond that pivot is wider and your reward is smaller. Measure that cost before deciding the setup is worth taking.
- Backtest from the confirmation bar. Your earliest legal entry is the close of the bar that confirms the pivot. Entering at the pivot itself in a backtest is classic look-ahead bias and will inflate results dramatically.
Turning divergence into an actual trade
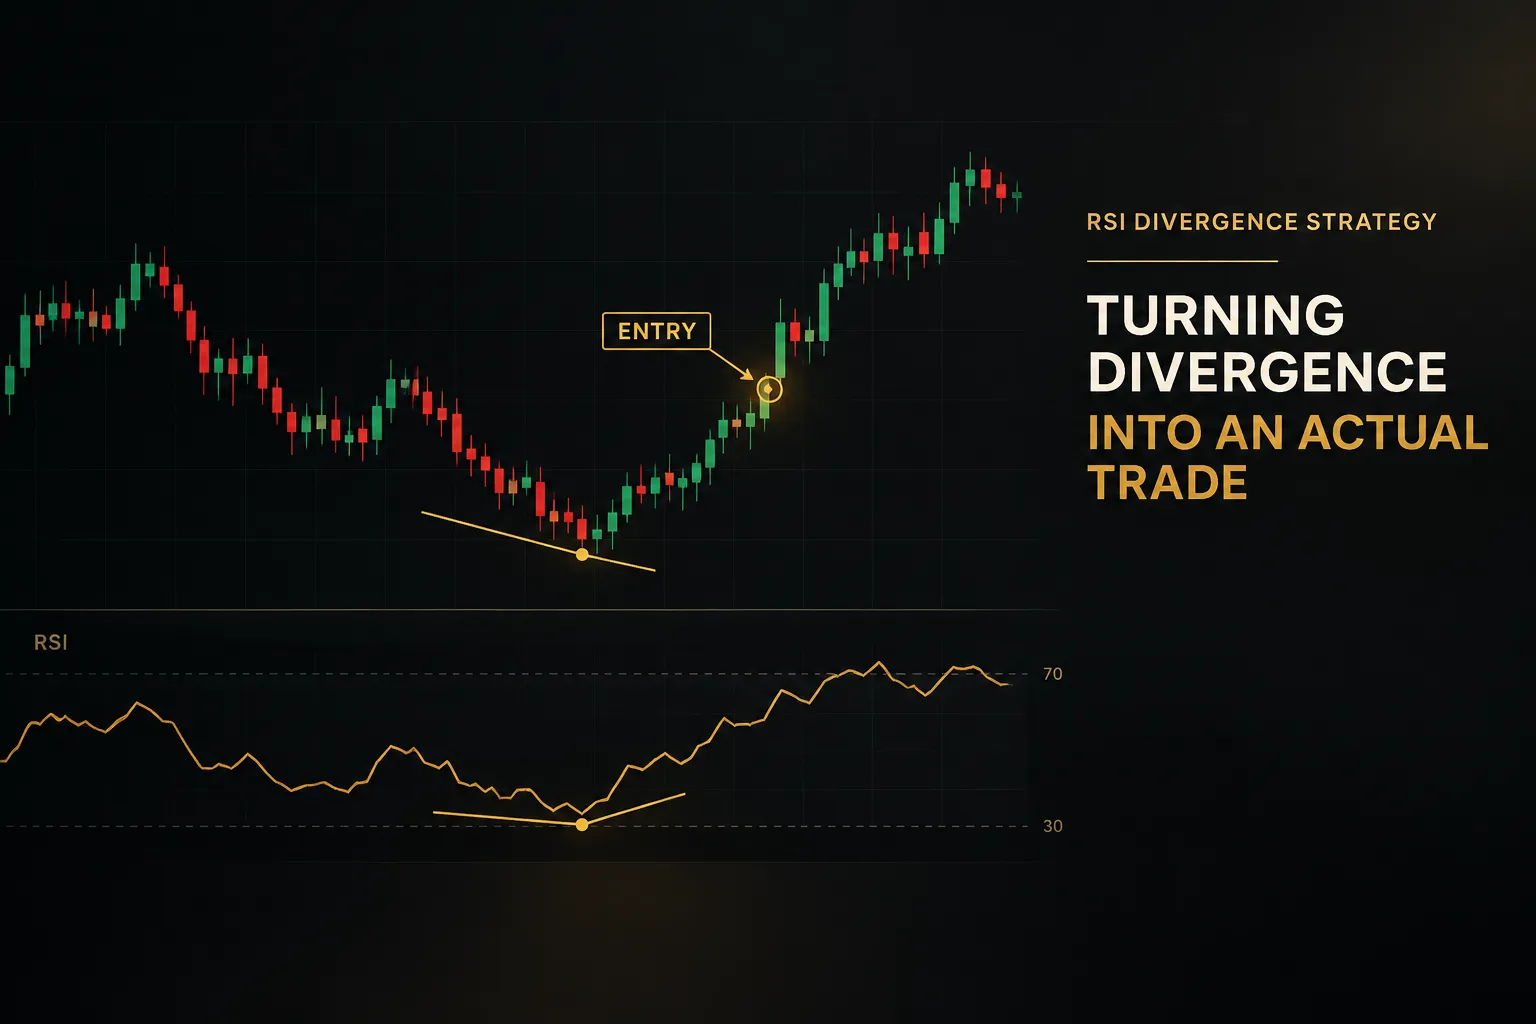
So you have a clean, objective divergence.
Now what?
This is where most traders get hurt, because a valid pattern and a valid trade are two different things.
RSI regime, not just 30 and 70
The textbook RSI overbought and oversold levels of 70 and 30 assume a market with no trend. Real markets trend. Andrew Cardwell and Constance Brown both documented that RSI shifts its operating range depending on the trend: in uptrends it tends to oscillate roughly between 40 and 80, and in downtrends between 20 and 60.
That changes how you read divergence. If price is trending up and RSI keeps pulling back to the 40 to 50 zone and bouncing, the trend is healthy, even if a bearish divergence just printed at the top.
The regime overrides the pattern.
The mirror applies in downtrends.
RSI repeatedly stalling at 50 to 60 means sellers are in control, and a bullish divergence at the lows is more likely a pause than a bottom. A reading above 70 in a strong uptrend can persist for weeks; shorting it mechanically is how accounts drain slowly.
A second trend filter helps. The average directional index (ADX) above 25 typically signals a trending market where regular divergence is less reliable, while ADX below 20 suggests a range where it behaves better.
Confirmation that adds information
Here is a trap that looks like diligence. Traders “confirm” RSI divergence with MACD divergence or a moving average crossover, but all three are built from the same closing prices.
Stacking them is like asking the same witness three times and calling it three testimonies.
Useful confirmation comes from a different source of information. Good candidates include:
Price action and market structure: a break of the minor swing low after bearish divergence (or swing high after bullish divergence) shows that sellers or buyers have actually taken control.
Trendline breaks serve a similar purpose.
Candlestick confirmation, such as an engulfing bar, matters most when it forms at real support and resistance rather than in the middle of nowhere.
Volume confirmation adds another independent layer. Declining volume into the second pivot, followed by expanding volume on the break, tells you participation is shifting, which the RSI alone cannot show.
Entries, stops, and exits
Separate direction from entry.
Multi-timeframe analysis does exactly that: confirm the higher-timeframe trend first, then act only on lower-timeframe divergences that agree with it. A hidden bullish divergence on the 15-minute chart is far more interesting when the 4-hour and daily trends are both up.
Tools can make this check faster. PipTrend’s 12-timeframe confirmation table, for example, shows trend direction across timeframes in one view, while its session-based entry levels give you specific prices to act on during London or New York hours. Direction comes from the table; timing comes from the divergence plus a price-action trigger.
Once the trade is on, every exit should be defined in advance:
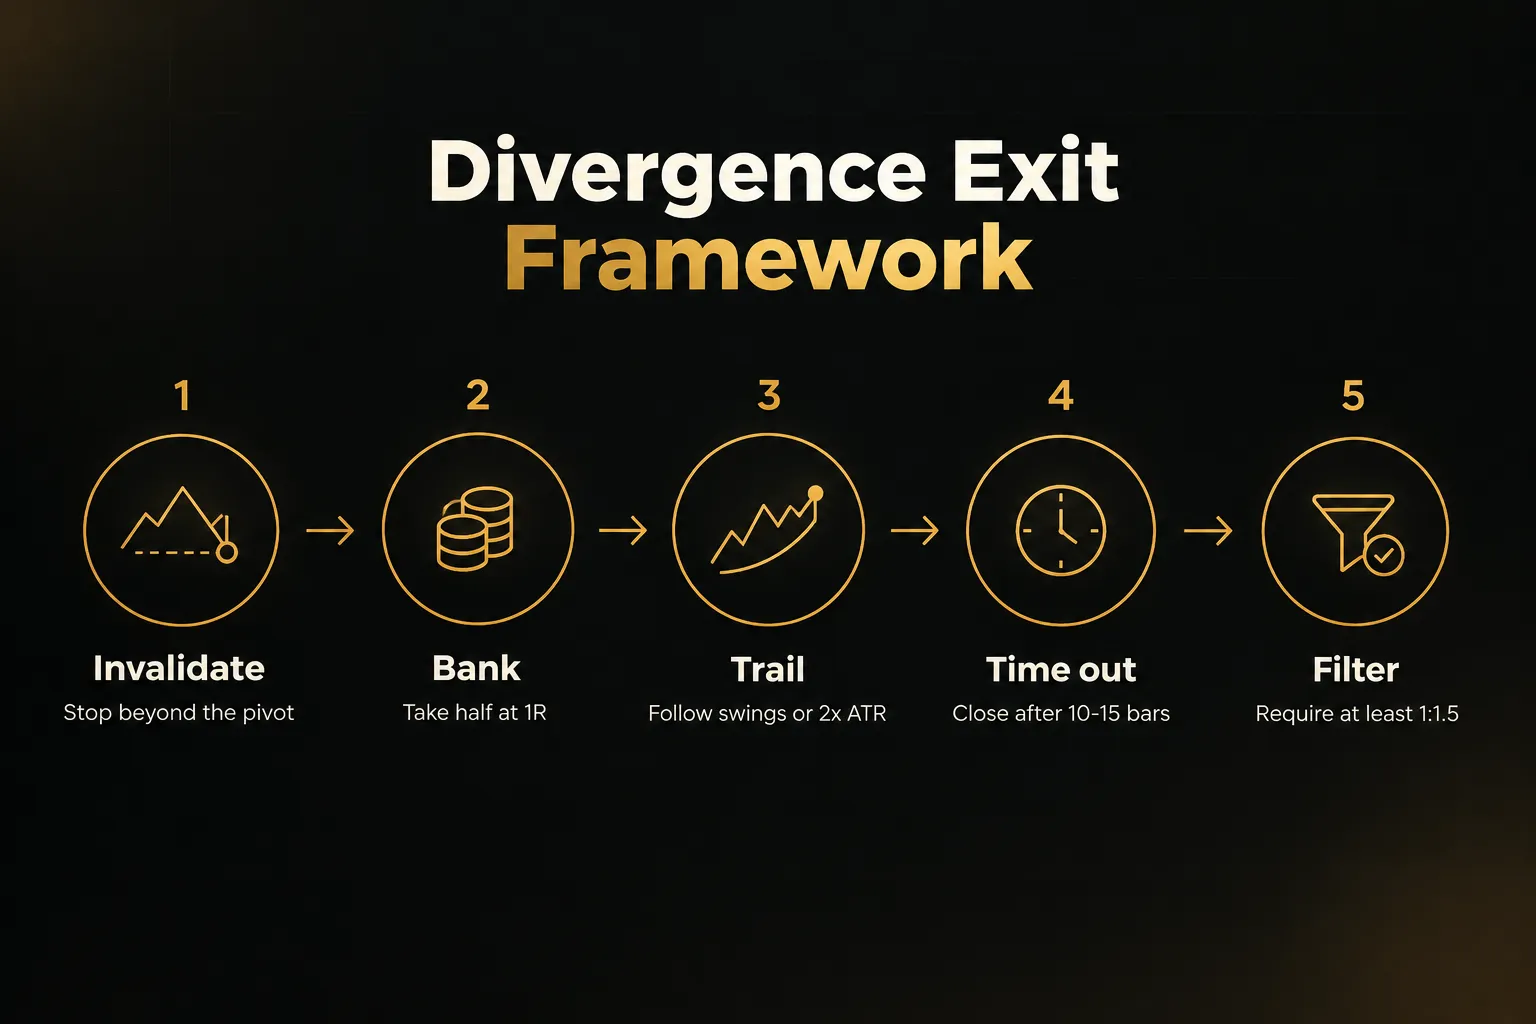
Invalidation level. Place the stop beyond the divergence pivot, plus a buffer such as 0.5x ATR. If price makes a new extreme past that point, the divergence is dead.
Partial profit. Take a portion, often half, at 1R or at the first opposing support and resistance level. This funds the trade and reduces emotional pressure.
Trailing stop. Trail the remainder behind each new swing point or at 2x ATR. Let the market decide how far the move goes.
Time-based exit. If the trade has not reached 1R within a set number of bars (10 to 15 is a reasonable start), close it. Divergence that does not resolve quickly usually is not working.
Minimum risk-to-reward ratio. Skip any setup where the distance to the first logical target is less than 1.5 times the stop distance. Because of confirmation lag, many divergences fail this test, and skipping them is the point.
When divergence works and when it fails
Divergence is not equally useful everywhere. Its reliability depends heavily on the market regime, and knowing which regime you are in is half the strategy.
Divergence across market regimes
| Market regime | Regular divergence reliability | Typical failure mode | Rule that protects you |
|---|---|---|---|
| Strong trend (ADX above 30) | Low for reversals; hidden divergence works better | Multiple stacked divergences while price keeps extending | Regime filter: trade only with the higher-timeframe trend |
| Ranging market (ADX below 20) | Moderate to good near range edges | Signals in the middle of the range that go nowhere | Trade only at defined support and resistance |
| Low volatility (ATR near multi-week lows) | Poor; RSI swings are tiny and noisy | Divergence of 1 to 2 RSI points that means nothing | Minimum RSI difference plus minimum ATR threshold |
| News-driven spike | Very poor in the first hours | RSI saturates, price gaps through the pivot | No new entries until the event bar is followed by structure |
| Transitional (trend slowing, ADX falling from above 30) | Best conditions for regular divergence | Entering before structure actually breaks | Confirmation wait: require a minor swing break |
Consider a typical failure.
An index is in a strong daily uptrend with ADX at 34. On the 4-hour chart, RSI prints a regular bearish divergence, the trader shorts immediately, and price rallies another 4%, then prints a second divergence, then a third.
Three rules would have changed the outcome.
The regime filter blocks the trade because the higher timeframe is strongly up and RSI never dropped below 40. The confirmation wait blocks it because no swing low ever broke.
And if both were ignored, an ATR stop-loss beyond the pivot would have capped the damage at 1R instead of a slow, unmanaged bleed.
A decision tree: ignore, monitor, or trade
| Condition | Action | Reason |
|---|---|---|
| Divergence opposes a strong higher-timeframe trend (ADX above 30, RSI holding its trend range) | Ignore | Momentum is slowing, but the trend has not broken |
| Higher-timeframe trend is flattening or ADX is falling | Monitor | Conditions are transitional; wait for structure to break |
| Confirmed pivot plus price-action trigger, regime neutral or favorable | Trade | Momentum warning and price evidence agree |
| Hidden divergence aligned with higher-timeframe trend | Trade with confirmation | Continuation setups carry the trend’s tailwind |
| Setup fails the 1:1.5 risk-to-reward minimum | Skip | Confirmation lag consumed too much of the move |
Backtesting it honestly
Fifteen screenshots are not a backtest.
A credible test needs enough trades, clear metrics, and data the strategy has never seen.
| Metric | Working standard | Why it matters |
|---|---|---|
| Sample size | At least 100 trades, ideally 200 or more | Small samples make luck look like skill |
| Win rate | Read alongside average win and loss | A 40% win rate can be very profitable at 1:2 reward |
| Profit factor | Above 1.3 after costs | Gross profit divided by gross loss; below 1.0 loses money |
| Expectancy | Positive, in R per trade | (Win rate x average win) minus (loss rate x average loss) |
| Maximum drawdown | A level you could actually sit through | Strategies get abandoned at the bottom of drawdowns |
| Out-of-sample validation | Hold back 30% of data untouched | Catches curve-fitting to one period’s quirks |
Risk normalization ties it together.
An ATR-based stop sets distance by volatility, for example 1.5x the 14-period ATR beyond the pivot, and position sizing then sizes the trade so every loss costs the same percentage of the account.
Example: with a $10,000 account risking 1% ($100), EUR/USD with a 60-pip ATR gets a 90-pip stop, so at $10 per pip per standard lot you trade about 0.11 lots. Gold with a $25 ATR gets a $37.50 stop, so you trade about 2.7 ounces.
Different instruments, identical risk.
FAQ
What is the most accurate RSI divergence strategy?
The most reliable RSI divergence strategy trades only confirmed pivots, in the direction of the higher-timeframe trend, after a price-action trigger. Hidden divergence aligned with the trend usually outperforms counter-trend regular divergence.
No accuracy figure means anything without defined entry, exit, and sample-size rules.
How do you trade bullish and bearish RSI divergence?
You trade bullish and bearish divergence by waiting for the second pivot to confirm, then entering on a break of minor structure. For bullish setups, place the stop below the divergence low plus an ATR buffer; for bearish setups, above the high.
Require at least 1:1.5 reward to risk before entering.
Is RSI divergence better than RSI overbought and oversold signals?
RSI divergence is generally more informative than raw overbought and oversold readings, because it compares momentum across two swings rather than a single level. Fixed 70/30 levels fail often in trends, where RSI can stay elevated for weeks.
Both work best when interpreted through the RSI regime.
What indicator works best with RSI divergence?
The best companion to RSI divergence is not another oscillator but independent information such as price action, market structure, volume, or ADX. MACD and moving averages share RSI’s inputs, so they mostly repeat the same message.
ADX helps classify the regime; structure breaks confirm the turn.
What is the success rate of RSI divergence?
RSI divergence has no single success rate.
Results depend on pivot settings, timeframe, market, regime filters, and exit rules, so quoted figures without those details are meaningless. Backtest your exact rules on at least 100 trades and judge by expectancy, not win rate alone.
Can RSI divergence predict a trend reversal?
RSI divergence cannot predict a trend reversal; it can only warn that momentum is weakening. Many divergences resolve into sideways consolidation or continuation instead.
Treat it as a reason to watch for structural breaks, not as a forecast, and let price action confirm.
The one rule that fixes most divergence trades
If you keep only one idea from this playbook, keep this: never enter on divergence alone. Wait for a confirmed pivot, then a price-action trigger, and take it only in the direction of the higher-timeframe trend.
That single rule filters out the majority of losing setups. It sidesteps repainting, respects the RSI regime, and forces you to see real evidence before risking money.
The full decision logic fits in one breath.
Identify divergence with objective pivots and a single price source; check the regime and ignore signals fighting a strong trend; confirm with structure, not with another oscillator; enter only when reward is at least 1.5 times risk; size the position with an ATR stop so every loss costs the same.
Simple to state.
Harder to follow when a perfect-looking divergence is staring back at you… which is exactly why the rules exist.
Before trading any of this live, open a demo chart and apply the process with fixed rules for at least 100 trades. Log every setup, including the ones you skipped.
If the expectancy holds up out of sample, you have a strategy.
If not, you have saved yourself an expensive lesson.
Sources
Risk Disclaimer: Trading involves risk. Past performance doesn't guarantee future results. Only trade with money you can afford to lose. PipTrend is a tool to assist your trading decisions, not financial advice.