
In 2025’s fast-paced markets, spotting the right doji candle pattern can be the difference between profit and loss. False signals and sudden indecision are more common than ever, making clarity essential.
This guide cuts through the noise and demystifies the doji candle pattern, empowering you to read market sentiment with confidence. You’ll discover how these patterns reveal hidden shifts that many traders miss.
Get ready for clear, actionable steps and up-to-date strategies designed for modern trading. Mastering doji candles will give you the edge you need to make smarter decisions.
Here’s what to expect: Doji basics, pattern types, advanced analysis, integration with technical indicators, and practical trading strategies—all broken down for today’s markets.
Doji Candle Pattern Fundamentals: What Every Trader Needs to Know
Recognizing the doji candle pattern is a foundational skill for any trader navigating today’s markets. At its core, a doji candle pattern forms when a security’s opening and closing prices are nearly identical within a single period, creating a candle with a very thin or nearly invisible real body.
This unique formation signals a moment of indecision between buyers and sellers. Neither side wins the session, which often leads to a visual cross or plus sign on the candlestick chart. The doji candle pattern stands out because it captures a critical pause—where momentum stalls, and the next move becomes uncertain.
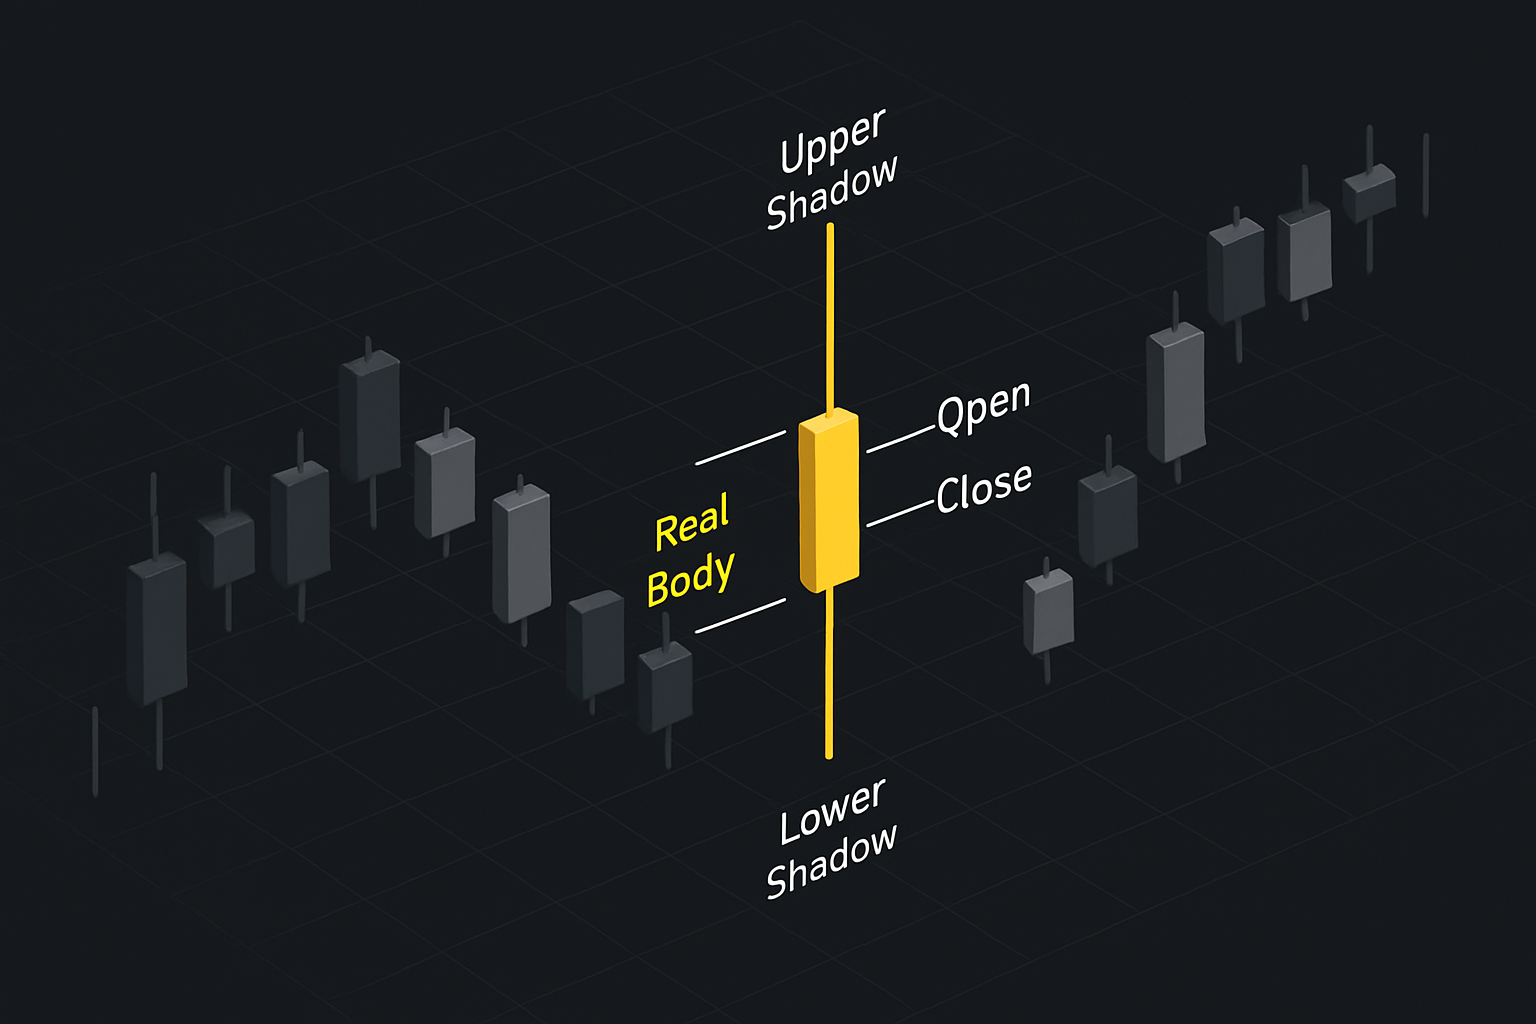
Anatomy of a Doji Candle Pattern
Understanding the anatomy of a doji candle pattern is essential for accurate interpretation. Each doji displays:
- Real body: Extremely narrow, as the open and close are almost equal.
- Upper wick (shadow): Shows the session’s high, reflecting how far buyers pushed the price.
- Lower wick (shadow): Marks the session’s low, indicating the extent of seller pressure.
This structure reveals a tug-of-war. The market tests both higher and lower prices, but ultimately closes where it started. Consider this simple code example for open/close logic:
if abs(open - close) <= small_threshold:
 print("Doji candle pattern detected")
Why the Doji Candle Pattern Matters in Technical Analysis
The doji candle pattern is a staple in technical analysis and price action trading. It’s used by traders to spot indecision, potential turning points, or pauses in trends. When a doji appears after a strong directional move, it can suggest that momentum is fading—though this isn’t always a guarantee of reversal.
Incorporating doji signals into your strategy can help you better time entries and exits. For a more in-depth look at the formation and uses of this pattern, you can review the What Is a Doji Candle Pattern, and What Does It Tell You? guide.
Market Psychology and the Doji Candle Pattern
The doji candle pattern is not just a technical signal; it reflects real market psychology. When traders see a doji, they’re witnessing a standoff. Bulls and bears are equally matched, and neither can dominate the session.
This pattern is significant in both bullish and bearish markets. In an uptrend, a doji may warn that buyers are losing steam. In a downtrend, it can suggest sellers are running out of power. However, context is key: the same pattern might mean consolidation if the market is already range-bound.
Doji Statistics and Frequency in 2025
Recent statistics show that the doji candle pattern appears more frequently in high-volatility periods. According to 2025 competitor insights, traders observed a notable increase in doji occurrences on major assets during market uncertainty.
Here’s a comparison table of doji frequency versus other common patterns:
| Pattern | Frequency in High Volatility | Typical Signal |
|---|---|---|
| Doji | High | Indecision/Pause |
| Hammer | Moderate | Bullish Reversal |
| Shooting Star | Moderate | Bearish Reversal |
| Spinning Top | High | Weak Indecision |
Charts often show clusters of doji candles during news releases or before major breakouts, making them a key pattern to watch in 2025.
Common Misconceptions About the Doji Candle Pattern
One of the biggest mistakes traders make is assuming every doji candle pattern signals a reversal. In reality, doji candles can also indicate continuation or simple market pause, especially in choppy or sideways conditions.
Confirmation is crucial. Without a follow-up candle or supporting evidence, trading solely on a doji can lead to false signals. Always consider volume, trend, and broader context before acting on the doji candle pattern.
Types of Doji Patterns: Recognition and Meaning in 2025
The doji candle pattern is not a one-size-fits-all signal. Instead, it comes in several distinct forms, each with its own story about market psychology. Recognizing these subtle differences is vital for traders aiming to decode indecision and anticipate price moves in 2025’s dynamic markets.
Below, we break down the five most important types of Doji patterns, highlighting their unique structures, the sentiment they reveal, and how to read them for smarter trading decisions.
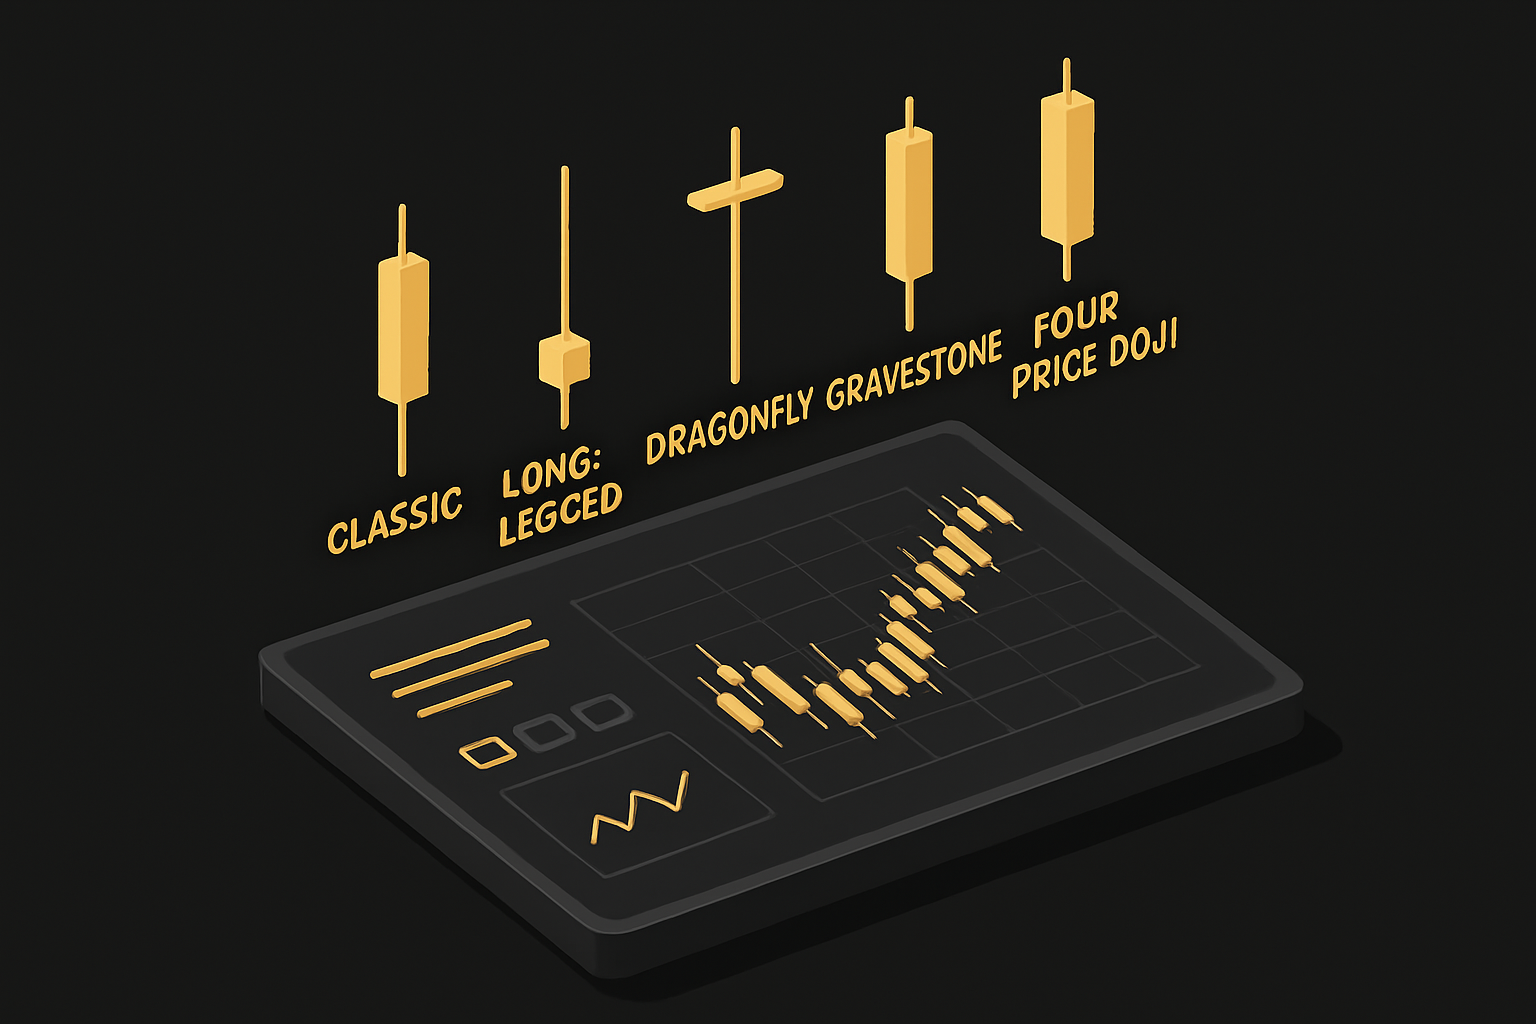
Classic Doji
The classic doji candle pattern is characterized by a nearly identical open and close, forming a thin or almost invisible real body. Both upper and lower wicks are present but usually moderate in length. This pattern signals a temporary stalemate between buyers and sellers.
When you spot a classic doji candle pattern in a sideways or range-bound market, it often reflects a pause as traders await new information. In trending markets, its meaning shifts—it may hint at a potential reversal or simply a continuation, depending on volume and subsequent price action.
Frequency data shows that classic doji patterns appear more often in high-volatility environments, such as major forex pairs or crypto assets. However, it’s essential to remember that a doji candle pattern is not always a reversal sign. Context matters: a doji in a strong uptrend may just indicate a breather, not a trend change.
For a deep dive into how the classic doji performs in real trading—and what backtesting over thousands of trades reveals—see this Doji Candlestick Pattern Explained & Backtested (2025) resource.
Long-Legged Doji
The long-legged doji candle pattern stands out with its pronounced upper and lower shadows, dwarfing the tiny central body. This dramatic wick length speaks to heightened market volatility and extreme indecision—bulls and bears push price far from the open, only to have it snap back by the close.
You’ll often see the long-legged doji candle pattern around major news releases or before significant breakouts, as traders hedge or unwind positions. For example, a long-legged doji just before a new economic report can signal that neither side wants to commit, setting the stage for a powerful move once uncertainty resolves.
Be cautious: without follow-up confirmation, the long-legged doji candle pattern can produce false signals. In 2025, data shows increased occurrences during fast algorithm-driven sessions, making patience and confirmation more important than ever.
Dragonfly Doji
The dragonfly doji candle pattern is instantly recognizable by its long lower wick and the absence of an upper shadow. The open, high, and close are nearly identical at the top of the range, while the low dives much lower.
This structure often hints at a bullish reversal, especially when it appears after a sustained downtrend. The dragonfly doji candle pattern signals that sellers drove price sharply lower, but buyers stepped in aggressively, erasing the drop by the close.
For added reliability, look for the dragonfly doji candle pattern at established support zones and when accompanied by a spike in trading volume. This confluence boosts the odds of a genuine trend reversal rather than a fleeting bounce.
Gravestone Doji
The gravestone doji candle pattern flips the dragonfly upside down. Here, the open, low, and close cluster at the bottom of the range, with a long upper shadow indicating that buyers tried to push price higher but ultimately failed.
After an uptrend, the gravestone doji candle pattern often flashes a warning of potential bearish reversal. For example, spotting this pattern at a known resistance level can alert traders to waning bullish momentum.
However, it’s wise to wait for a strong bearish candle or a volume surge on the next bar before acting. The gravestone doji candle pattern alone isn’t always a reliable sell signal without confirmation.
Four Price Doji
The four price doji candle pattern is the rarest of the group. Here, the open, high, low, and close are all exactly the same, forming a tiny, featureless cross.
This pattern screams extreme indecision or, more likely, illiquidity—think thinly traded assets or after-hours sessions. The four price doji candle pattern is usually not actionable for most trading strategies, since it doesn’t provide enough information about market sentiment or direction.
If you see this pattern, it’s often best to stand aside. It’s more a sign of a market taking a breather than a setup to trade.
How to Analyze Doji Patterns in Modern Markets
Understanding how to interpret the doji candle pattern in today’s dynamic markets is essential for traders seeking an edge. Markets in 2025 are faster and more volatile than ever, so relying on outdated methods can lead to costly mistakes. Let’s break down the core techniques for analyzing doji candle pattern signals with precision.
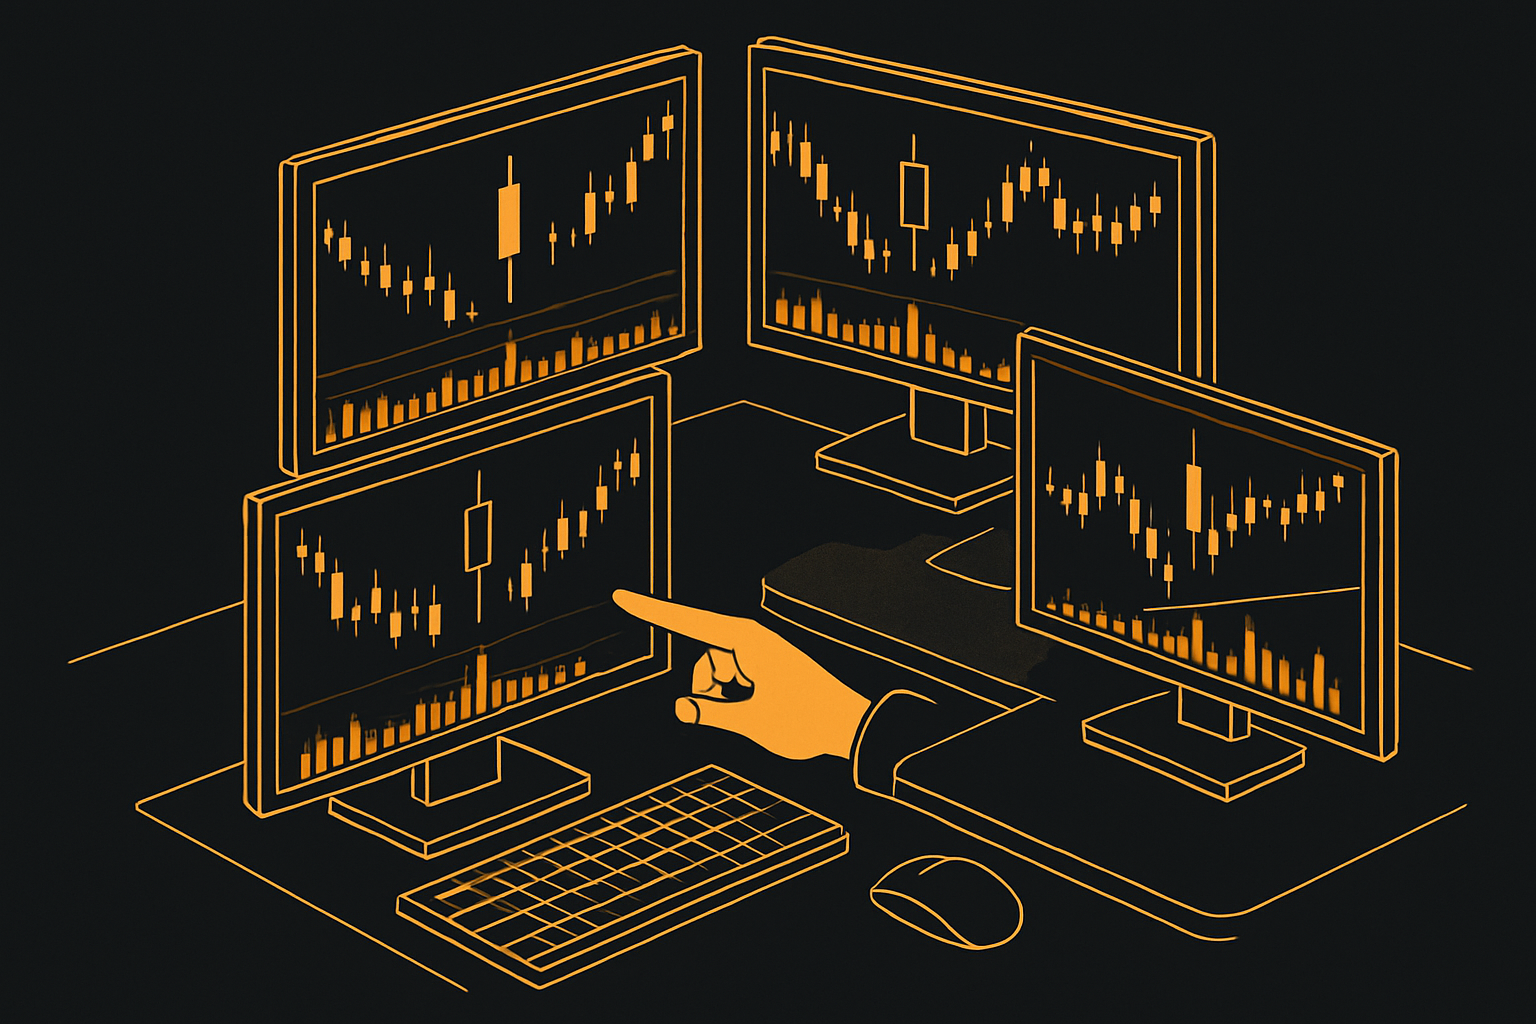
Contextual Analysis: Trend, Volume, and Timeframe
The doji candle pattern always needs to be analyzed within its market context. Start by identifying the prevailing trend—up, down, or sideways. A doji candle pattern in a strong uptrend could suggest a potential pause or reversal, while one in a range-bound market might simply reflect ongoing indecision.
Volume plays a crucial role. When a doji candle pattern appears alongside a volume spike, it’s a sign that market participants are actively battling for control. This increases the pattern’s significance and hints at a possible shift in momentum.
Timeframe selection is just as important. According to competitor data, the doji candle pattern is most reliable on daily, 4-hour, and weekly charts. Here’s a quick comparison:
| Timeframe | Reliability | Use Case |
|---|---|---|
| 1H | Low | Intraday noise |
| 4H | Medium | Swing trading, crypto |
| Daily | High | Stocks, forex, crypto |
| Weekly | Highest | Long-term trend analysis |
Avoid reading too much into a doji candle pattern during choppy or illiquid periods, as these can produce false signals. Always cross-check with the broader trend and volume before making decisions.
Confirmation Techniques: Avoiding False Signals
One of the most common mistakes is acting on a single doji candle pattern without waiting for confirmation. Instead, look for a strong follow-up candle—such as a bullish or bearish engulfing pattern—that closes decisively above or below the doji’s range.
Combining the doji candle pattern with support and resistance levels further increases the odds of a successful trade. For instance, a doji forming at a well-established resistance zone, followed by a bearish engulfing candle, provides a higher probability setup.
A step-by-step process for confirmation:
- Identify the doji candle pattern at a key level
- Wait for the next candle to close strongly in the anticipated direction
- Confirm with increased volume
Statistics show that more than half of doji candle pattern signals fail without confirmation. In fact, as detailed in The Doji Myth: 8,029 Trades Prove It Wrong, relying solely on the doji without follow-up can lead to subpar results.
Always remember: patience pays off. Avoid jumping in on the first sign of indecision.
Integrating Doji with Technical Indicators
To boost the reliability of the doji candle pattern, traders often combine it with technical indicators. Overlays like RSI, MACD, and moving averages can help filter out false signals and add confidence to your analysis.
For example, if a doji candle pattern appears at oversold levels on the RSI, the probability of a bullish reversal increases. Similarly, a long-legged doji paired with a bullish MACD crossover can signal a strong buying opportunity.
Here’s a quick checklist for confluence:
- Doji candle pattern at key support/resistance
- RSI or MACD signaling overbought/oversold or crossover
- Volume spike accompanying the pattern
Data from competitor insights suggests that trades using both the doji candle pattern and technical indicators show a higher win rate compared to using either alone. However, avoid overloading your charts; too many indicators can cloud your judgment and reduce the effectiveness of price action analysis.
In summary, integrating the doji candle pattern with context, confirmation, and technical tools creates a robust framework for navigating modern markets.
Advanced Doji Trading Strategies for 2025
Unlocking the full potential of the doji candle pattern means moving beyond basic identification and diving into structured, modern trading strategies. In 2025’s fast-paced markets, successful traders blend technical precision with proven processes. Let’s walk through each advanced step to help you turn the doji candle pattern into a reliable signal for smarter trading.
Step 1: Identify the Doji and Market Context
Start by clearly identifying the doji candle pattern on your chart. Look for candles where the open and close are nearly identical, and pay attention to the length of the wicks.
Next, assess the broader market context. Is the market trending or ranging? Is there a spike in volume? These clues help you determine if the doji candle pattern is signaling a genuine shift or just noise.
Checklist for Initial Assessment:
- Spot the doji candle pattern (open ≈ close)
- Analyze trend direction (uptrend, downtrend, sideways)
- Check for volume spikes
- Note recent volatility or news events
By grounding your analysis in context, you filter out low-probability setups and focus on high-quality trades.
Step 2: Wait for Confirmation and Validate Signals
Never trade a doji candle pattern in isolation. Always wait for confirmation from the next candle. Look for strong bullish or bearish closes, engulfing patterns, or a volume surge that supports the initial signal.
For example, after spotting a gravestone doji, wait for a bearish candle to close below the doji’s low. This step reduces the risk of false signals and protects you from market whipsaws.
- Confirmation types: engulfing candles, strong closes, volume spikes
- Risk: Entering too early without confirmation
Pairing the doji candle pattern with confirmation keeps your trades disciplined and increases your win rate. For more on validating price action, see this price action trading strategies guide.
Step 3: Combine with Support, Resistance, and Key Levels
The doji candle pattern gains power when it forms at significant price levels. Map out horizontal support and resistance zones, trendlines, and pivot points on your chart.
A dragonfly doji at a long-term support zone is far more meaningful than one in the middle of a choppy range. Use these key levels to filter out weak signals.
- Identify strong support/resistance
- Look for confluence with the doji candle pattern
- Higher success rate at major levels
When the doji candle pattern aligns with these zones, your probability of catching a genuine reversal or breakout increases significantly.
Step 4: Use with Technical Indicators for Confluence
For even greater confidence, overlay technical indicators such as RSI, MACD, or moving averages alongside the doji candle pattern. For instance, a long-legged doji plus an RSI showing oversold conditions can signal a strong potential reversal.
How to build confluence:
- Combine doji candle pattern with indicator signals
- Example: Bullish MACD crossover and doji candle pattern
- Avoid relying solely on indicators; prioritize price action
Confluence reduces false signals and helps you spot high-probability trades. Always weigh indicator readings against the core structure of the doji candle pattern.
Step 5: Manage Risk and Optimize Trade Entry
Effective risk management is essential when trading the doji candle pattern. Set your stop-loss just below the wick (for bullish setups) or above (for bearish setups). Adjust your position size based on the strength of the signal and market volatility.
- Place stop-loss at logical levels (just outside doji wick)
- Use tight stops for low-volatility patterns like the four price doji
- Calculate risk/reward before entering the trade
By managing risk proactively, you protect capital and give yourself room to let winners run.
Step 6: Real-World Case Studies and Backtesting Data
Applying these steps, traders have found that the doji candle pattern can outperform random entries when used with discipline. For example, backtesting from 2023–2025 shows that combining the doji candle pattern with confirmation and confluence led to higher win rates.
- Example: Dragonfly doji at support, confirmed by volume spike, resulted in a 3:1 reward-to-risk trade
- Failed trade: Classic doji in a sideways market with low volume, no follow-through
Learning from real trades—both successful and unsuccessful—sharpens your strategy and builds confidence in deploying the doji candle pattern.
Common Mistakes and Pro Tips for Trading Doji Patterns
Mastering the doji candle pattern takes more than memorizing its shape. Even experienced traders make costly mistakes when interpreting Doji signals. Let’s break down the most common pitfalls and how to avoid them, so you can trade with confidence in 2025.
Misinterpreting the Doji Candle Pattern
A classic mistake is treating every doji candle pattern as a guaranteed reversal. While Doji often signals indecision, it doesn’t always mean the trend is about to flip. Many traders jump in too soon, only to get whipsawed as the price continues in its original direction.
- Not all Dojis lead to reversals; some indicate trend continuation.
- Overreliance on the doji candle pattern without confirmation can lead to false entries.
- Always consider the broader price action before acting.
A better approach is to combine Doji analysis with other candlestick chart patterns guide for a more holistic view.
Ignoring Market Context and Volume
Another frequent error is analyzing the doji candle pattern in isolation, ignoring crucial context like trend direction, volume, or upcoming news events. Without these factors, the signal’s reliability drops.
- A Doji in a strong trend can mean a brief pause, not a reversal.
- Volume spikes can validate or invalidate the doji candle pattern.
- Significant news can overshadow technical signals.
Always ask: Is the Doji appearing at a key support or resistance level? Is there a volume surge? Context turns a vague signal into actionable insight.
Overtrading and Emotional Bias
High-volatility periods can flood your charts with doji candle patterns. Overtrading every signal is a recipe for losses and frustration.
- Don’t let FOMO push you into low-quality trades.
- Avoid trading the doji candle pattern during major economic events.
- Emotional decisions often lead to poor outcomes.
Discipline and patience are key. Sometimes, the best trade is the one you don’t take.
Pro Tips for Reliable Doji Candle Pattern Trading
Boost your success rate with these professional habits:
- Always wait for confirmation: Let the next candle reveal true direction.
- Combine with confluence: Use support/resistance, trendlines, and indicators alongside the doji candle pattern.
- Track your stats: Keep a journal of doji trades, noting win/loss ratios and circumstances.
- Set alerts: Automate notifications for high-probability setups.
Here’s a quick table comparing win rates:
| Strategy | Win Rate (%) |
|---|---|
| Doji pattern without confirmation | 34 |
| Doji pattern with confirmation & confluence | 61 |
These numbers highlight the power of patience and analysis.
Data-Driven Insights and Automation
Modern markets demand modern tools. Backtesting your doji candle pattern strategy against historical data can reveal strengths and weaknesses. Consider using automated detection systems or even AI-based solutions like those described in Encoding Candlesticks as Images for Patterns Classification Using Convolutional Neural Networks to spot patterns efficiently.
Set clear risk parameters, use technology to eliminate emotional bias, and focus on high-quality signals. With the right approach, the doji candle pattern becomes a powerful ally—not a source of confusion.
Doji Pattern FAQ: Your Top Questions Answered
Recognizing and interpreting the doji candle pattern can spark many questions, especially as markets evolve in 2025. Below, you’ll find answers to the most common queries traders have about these essential candlestick signals.
What does a doji candle pattern indicate?
A doji candle pattern forms when a market’s opening and closing prices are nearly identical. This unique shape signals indecision among buyers and sellers. The market pauses, and neither side gains control. While the doji candle pattern can hint at a potential reversal, it is just as often a sign of consolidation or a pause before the trend continues. Always analyze the pattern’s context for the most accurate interpretation.
Is a doji candle pattern bullish or bearish?
The doji candle pattern itself is neutral. Its meaning depends on the trend and the candles that follow. For example, after a downtrend, a dragonfly doji may suggest a bullish reversal—especially when confirmed by a strong bullish candle. In contrast, a gravestone doji after an uptrend can be a warning sign of bearish momentum. For deeper insight into these scenarios, explore our bullish candle pattern insights and bearish candle patterns explained to see how doji variations fit into broader strategies.
What is the difference between Dragonfly Doji and Gravestone Doji?
Here’s a quick comparison of these two powerful doji candle pattern types:
| Feature | Dragonfly Doji | Gravestone Doji |
|---|---|---|
| Structure | Long lower shadow, no upper | Long upper shadow, no lower |
| Typical Signal | Bullish reversal after downtrend | Bearish reversal after uptrend |
| Key Level | Support zones | Resistance zones |
| Confirmation | Strong bullish follow-up | Strong bearish follow-up |
Both require confirmation before acting, as false signals are common in fast-moving markets.
How reliable are doji candle pattern signals for trading decisions?
On their own, doji candle pattern signals are not highly reliable. Their strength increases when combined with other technical tools or when they appear at significant support or resistance levels. According to recent competitor statistics, confirmed doji trades have a much higher win rate—up to 62% with confirmation, compared to less than 35% without. Always use a multi-step approach: context, confirmation, and confluence.
What timeframes are best for identifying the doji candle pattern?
The doji candle pattern appears on all timeframes, but reliability improves on higher ones. Daily, 4-hour, and weekly charts tend to filter out noise and make doji signals more actionable. In contrast, short timeframes like 1-minute or 5-minute charts generate more false positives. Choose timeframes that align with your trading style and always assess the surrounding price action.
Can doji candle patterns be used in forex, crypto, and stocks?
Yes, the doji candle pattern is universal across asset classes. However, its frequency and reliability can vary:
| Market | Frequency | Reliability |
|---|---|---|
| Forex | High | Moderate |
| Crypto | High | Slightly lower (due to volatility) |
| Stocks | Moderate | High (especially on daily/weekly) |
Always adapt your analysis to the specific market’s volatility and liquidity.
How to avoid false signals with doji candle patterns?
To minimize false signals, follow these steps:
- Wait for confirmation from the next candle (engulfing, strong close).
- Check volume—spikes add credibility to a doji candle pattern.
- Use support/resistance for context.
- Combine with technical indicators for confluence.
Tracking your win/loss ratio and journaling trades will reveal which setups work best.
Are there automated tools for detecting doji candle patterns?
Absolutely. Most modern trading platforms offer candlestick pattern scanners or allow for custom scripts to spot the doji candle pattern. These tools can send alerts when a doji forms at critical levels, saving time and reducing oversight. Still, always review signals manually before making trading decisions.
Can you give an example of the doji candle pattern in different markets?
Certainly! In forex, a doji candle pattern at the end of a EUR/USD rally on a daily chart might warn of a trend pause. In crypto, a long-legged doji on Bitcoin’s 4-hour chart often appears before major news. For stocks, a gravestone doji at a key resistance on Apple’s weekly chart can precede a pullback. The versatility of the doji candle pattern makes it valuable for all asset classes.
How frequent and reliable are doji candle patterns in various asset classes?
Doji candle patterns are more frequent in volatile markets like crypto and forex, especially during news events. However, reliability is highest in stocks when paired with volume and confirmation. According to 2025 data, the doji candle pattern is confirmed as a successful reversal signal in about 40–50% of cases when used with proper context and confirmation techniques.
Now that you’ve got a clear handle on Doji patterns and how to spot reliable signals in today’s markets, it’s time to put your knowledge into action. Imagine having real-time alerts and clean, AI-driven analysis at your fingertips—so you never miss a key Doji setup, whether you’re trading forex, crypto, stocks, or indices. If you’re ready to cut through the noise and make smarter, more confident trades, let’s take the next step together.
See Your Trading Improve With PipTrend