Fair Value Gap Trading Without the Guesswork
On this page
Why Most FVG Advice Falls Short
Search “fair value gap trading” and you’ll find the same two claims repeated with total confidence: every gap eventually fills, and every gap marks where institutions placed orders.
Neither claim survives contact with a spreadsheet.
The problem isn’t that fair value gaps are useless. It’s that most content confuses a description of what price did with a hypothesis about what price will do next.
A three-candle imbalance is a geometric fact you can measure to the tick.
What happens after price returns to it is an open question that depends on your instrument, your timeframe, your filters, and your definition of “filled.”
This guide separates those two things deliberately.
First, the mathematical definition, precise enough that two traders marking the same chart get identical zones. Then the mitigation and fill-rate reality, including why published statistics vary so wildly. Then a full decision process covering market structure, liquidity, confirmation, entry, and risk. Finally, how to test it honestly and where automation genuinely helps.
The goal is a rules-based framework you can validate yourself.
Not a belief system.
If the rules produce positive expectancy on your data, trade them. If they don’t, you’ll know within a weekend of work.
What Exactly Is a Fair Value Gap?
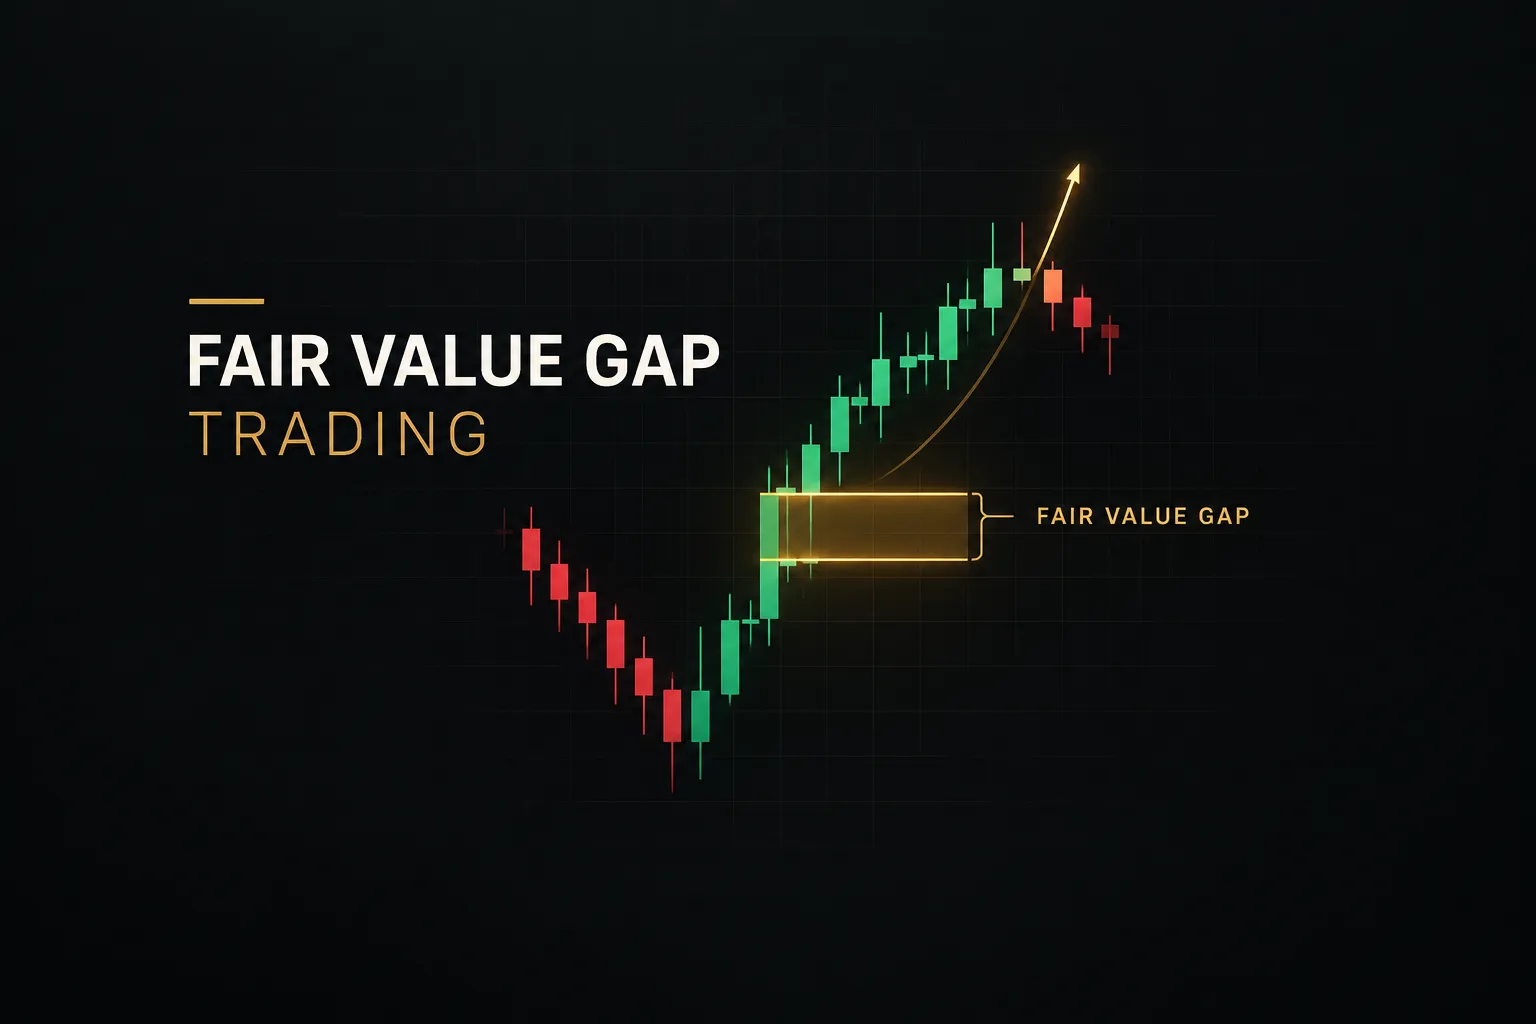
A fair value gap is a price inefficiency left behind when a market moves so fast in one direction that a range of prices never gets traded through by overlapping candles. It’s a visible hole in the price distribution, and it takes exactly three candles to confirm.
The Three-Candle Detection Rule
The rule is binary.
There is no interpretation involved.
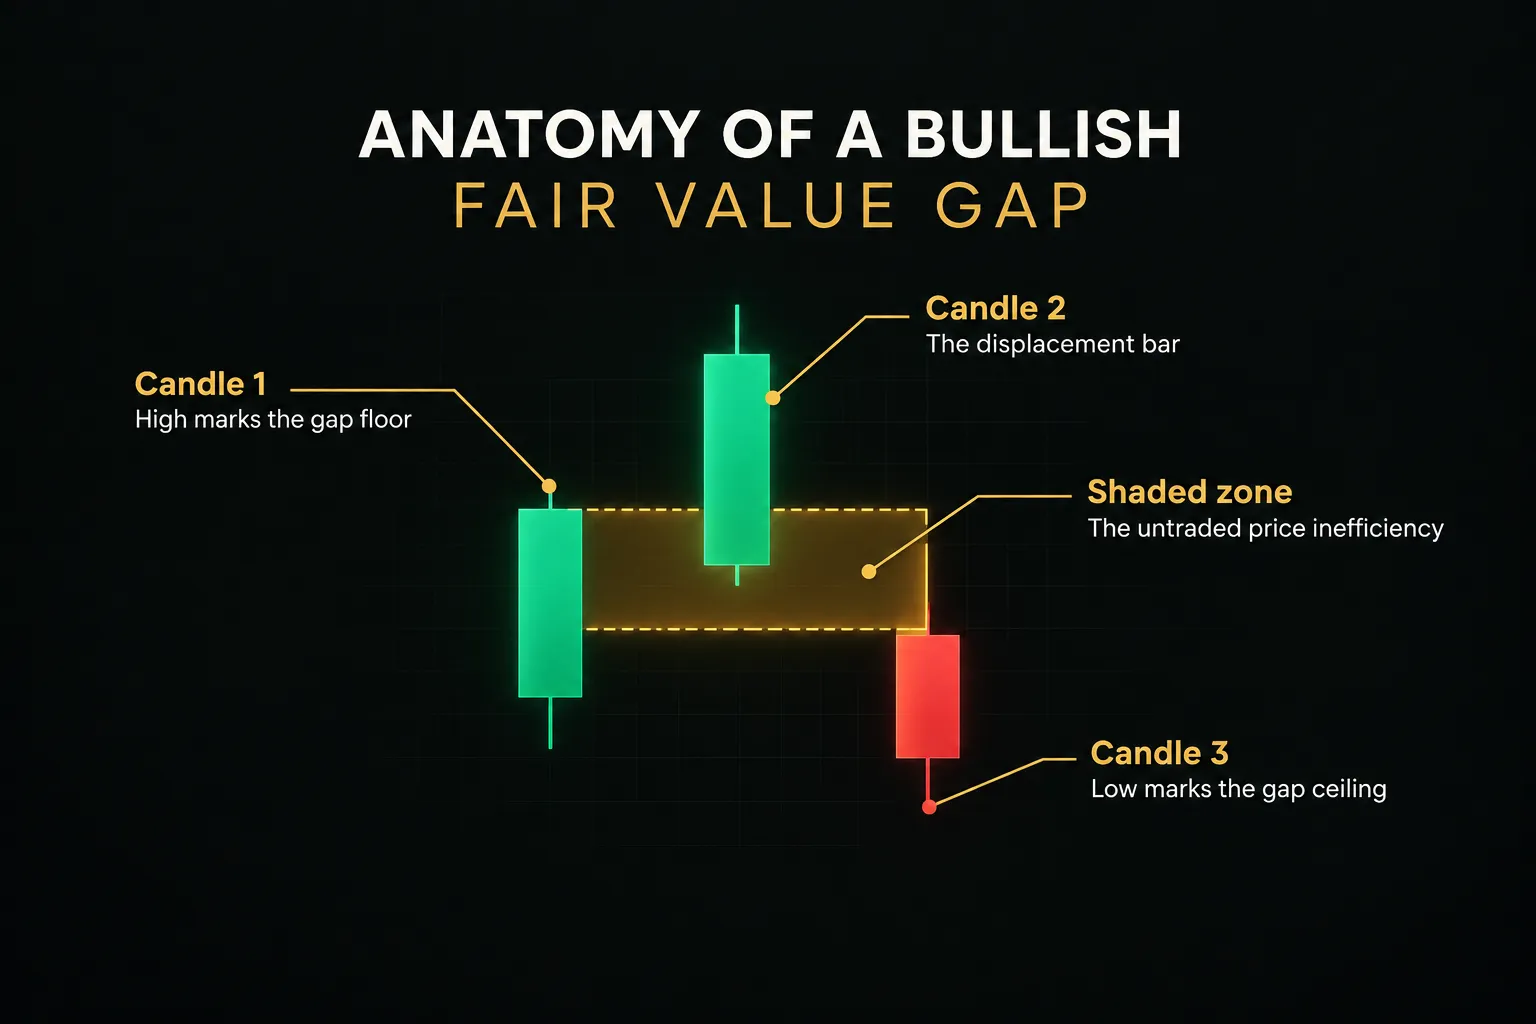
A bullish fair value gap exists when the low of candle 3 sits above the high of candle 1. A bearish fair value gap exists when the high of candle 3 sits below the low of candle 1.
Candle 2, the one in the middle, is the displacement candle: the aggressive move that creates the void.
If those conditions aren’t met, there is no gap.
Not a “weak” gap or a “partial” gap.
Nothing to mark.
Boundaries matter just as much as detection.
For a bullish gap, the zone runs from the high of candle 1 (the floor) to the low of candle 3 (the ceiling). For a bearish gap, it runs from the low of candle 1 down to the high of candle 3.
Wicks, not bodies.
Some traders use body-to-body measurement instead, which produces smaller zones and different backtest results.
Pick one convention and never mix them mid-study.
Bullish vs Bearish FVGs
Because of how they form, a bullish gap always sits below current price after the displacement, and a bearish gap always sits above it.
That’s arithmetic, not analysis.
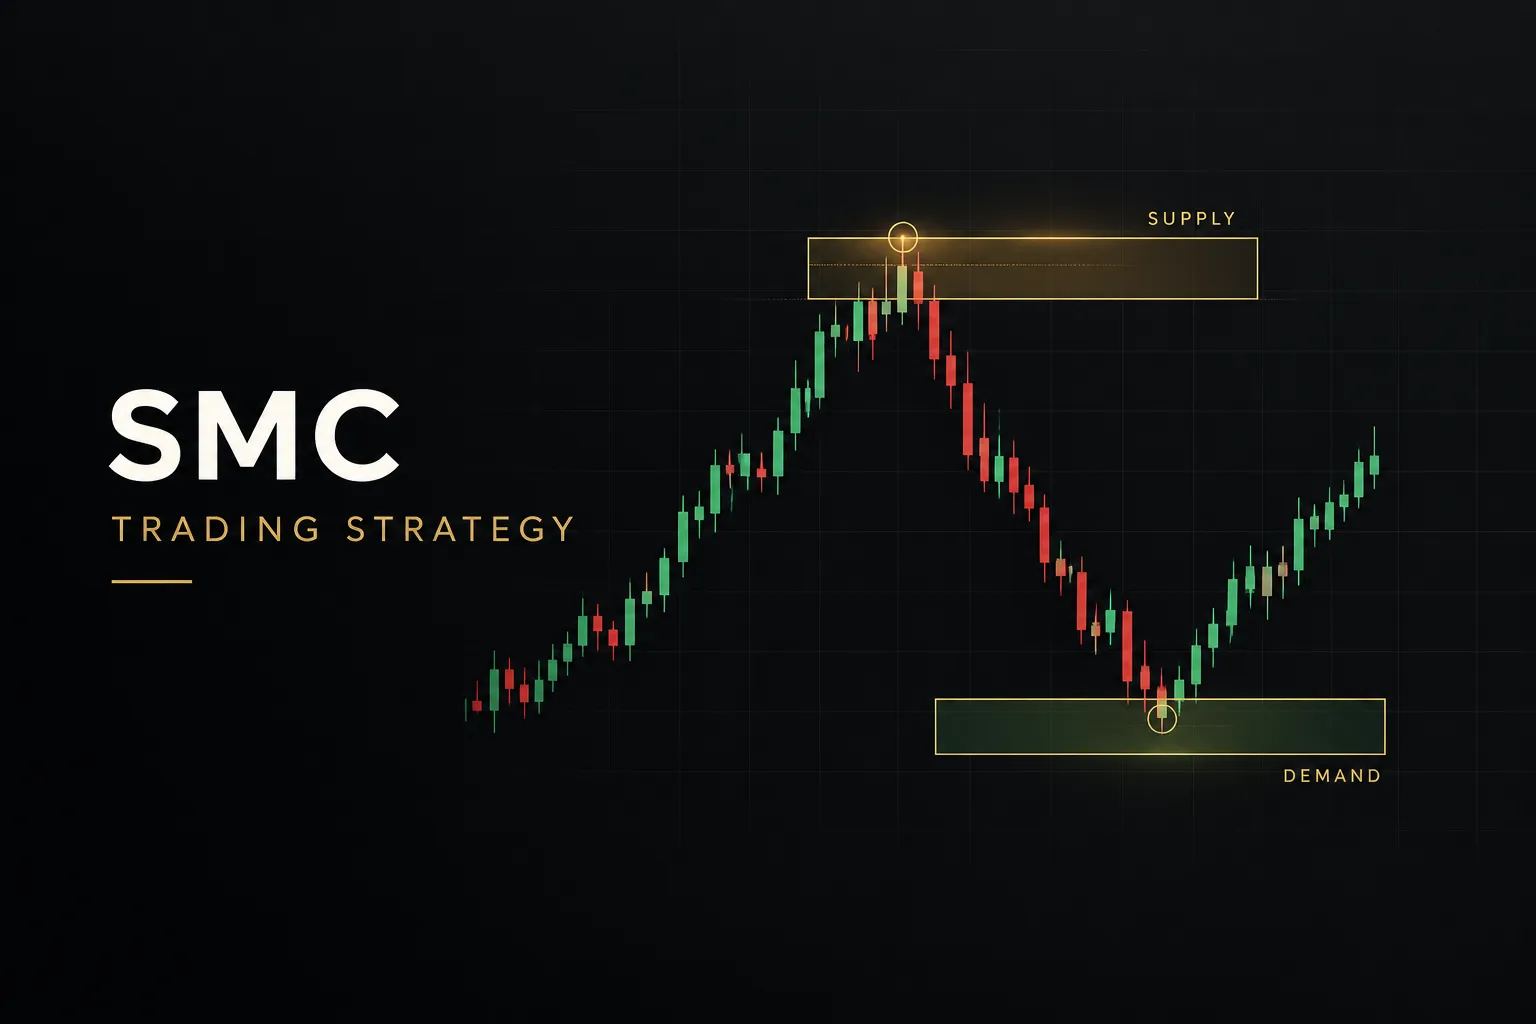
Traders label the bullish zone a potential demand area and the bearish zone a potential supply area.
Reasonable shorthand.
But location alone tells you nothing about whether price will react there.
A bullish gap forming in the middle of a sustained downtrend is still a bullish gap by definition, and it will very often get sliced through without hesitation.
The gap tells you where price moved inefficiently. It does not tell you that price owes that region anything.
This is where premium and discount zones become relevant. A bullish gap sitting deep in the discount half of a defined dealing range carries a different context than the identical pattern printed at the extreme premium of an extended rally.
Same geometry, different situation.
FVG vs a Traditional Gap
These get conflated constantly, and they are not the same thing.
A traditional session gap forms between one session’s close and the next session’s open. Stocks and futures produce these because trading genuinely stops.
No orders cross, news accumulates overnight, and price reopens somewhere else entirely. The empty space on the chart represents actual non-trading hours.
A fair value gap forms during continuous trading.
Nothing stopped.
The market simply displaced so rapidly that candle 1 and candle 3 failed to overlap. That’s why FVGs appear constantly in 24-hour markets like forex and crypto, where session gaps are rare or nonexistent.
One more distinction worth being honest about.
A candle-based imbalance is not verified evidence of an order-book imbalance, and it is not proof that institutional participants placed resting orders in that zone.
You cannot see the order book in a candlestick chart. What you can see is a liquidity void: a price range that got skipped.
Whether large participants care about it is an assumption, and assumptions need testing.
Does a Fair Value Gap Always Fill?
No.
And the statistics you’ve seen claiming otherwise are usually measuring something other than what they say they’re measuring.
What Counts as Mitigation
Mitigation is the point at which price returns into the gap and you consider the imbalance addressed. The trouble is that there are at least four defensible definitions, and each one produces a different number.
- Wick touch: any wick entering the zone by a single tick counts. Loosest definition, highest recorded fill rate.
- Partial fill to consequent encroachment: price reaches the 50% midpoint of the zone. This is the most commonly used middle ground.
- Full fill by wick: price trades through 100% of the zone, closing the entire inefficiency.
- Full fill by close: a candle must close beyond the far boundary. Strictest definition, lowest recorded fill rate.
You have to choose one before you backtest.
Deciding afterward, based on what looks better, is how people accidentally lie to themselves with real money.
Why Fill-Rate Stats Mislead
Three methodological choices account for most of the variance in published fill-rate claims.
The first is an unspecified observation window.
“Fair value gaps fill 90% of the time” means almost nothing if the study allowed unlimited time. Given enough years, most price levels get revisited.
A gap that fills 400 candles later is useless to an intraday trader who needed the trade resolved within a session.
The second is survivorship in the sample.
If a study only examines gaps that eventually filled, the fill rate is 100% by construction. Unfilled gaps still sitting open on the chart must be counted as unfilled, not excluded as “pending.”
The third is counting partial touches as full fills.
A wick that clips the top tick of a zone is not the same event as price closing through it, but plenty of studies record both as a fill.
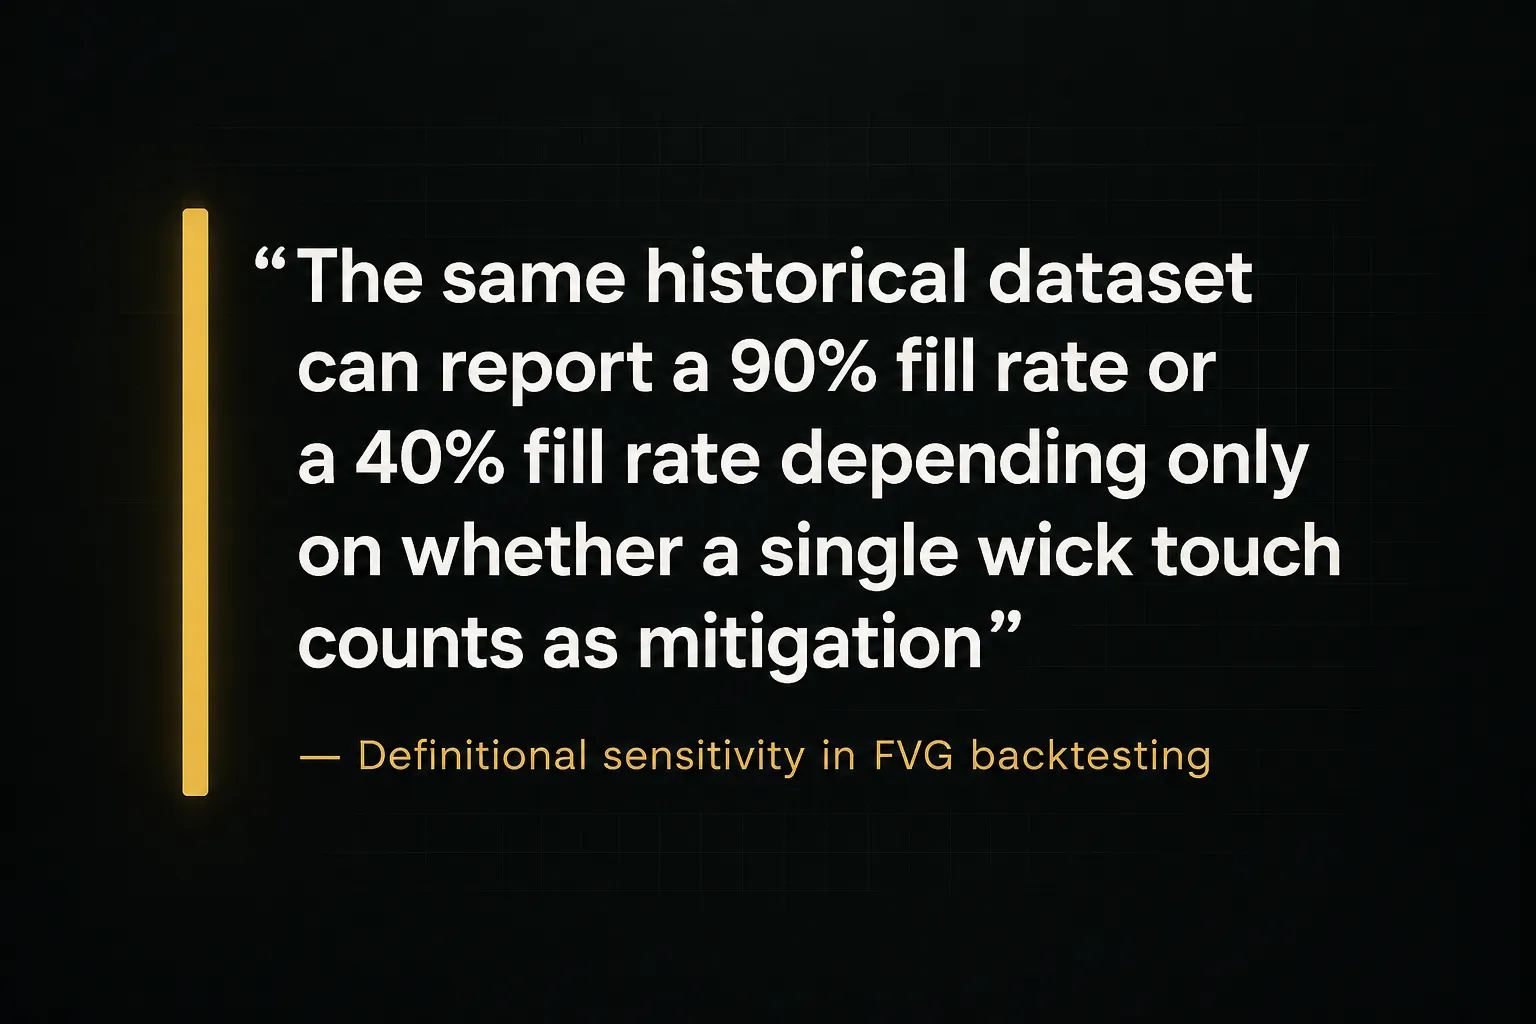
Run the identical dataset twice, once with wick-touch mitigation and a 200-candle window, once with close-through mitigation and a 20-candle window. You’ll get results that look like two different markets.
Neither is wrong.
They answer different questions.
The Inverse FVG
Sometimes a gap fails entirely.
Price closes decisively through a bullish fair value gap instead of bouncing from it, and the zone stops behaving like demand.
When that happens, the zone can flip polarity and act as resistance on a retest. This is the inverse fair value gap, and it’s a legitimate concept with a straightforward logic: participants who bought the original zone are now offside, and price returning to their entry creates supply.
Here’s the discipline part.
A failed bullish setup does not automatically become a valid bearish setup.
The inversion needs its own confirmation: a genuine break of structure in the new direction, or a clean rejection candle on the retest.
Flipping bias reflexively because the first idea lost is revenge trading with better vocabulary.
From Gap to Trade: A Decision Process
Detection is the easy part.
Turning a marked zone into a position with a defined stop, target, and size is where most of the edge (or the damage) actually lives.
Filtering for Quality Setups
Most gaps on any chart are noise.
A rejection checklist removes them before they cost you anything.
- Reject gaps smaller than a volatility threshold. Compare gap height to the 14-period ATR of that timeframe. A gap measuring under roughly 15% of average range gives you a zone so thin that spread and slippage swallow the entire premise.
- Reject gaps forming into opposing higher-timeframe structure. A bullish 5-minute gap printing directly beneath a well-respected daily supply zone is a trade against the dominant flow. The odds are not in your favor and the stop rarely holds.
- Reject gaps created by scheduled news or abnormal spread. A displacement candle produced by an NFP release or a central bank statement reflects a repricing event, not accumulated order flow. Spread widening during those windows also makes your recorded entry price fictional.
- Reject gaps formed in thin session liquidity. A gap printed during the Asian session lull on a EUR pair, or in the final ten minutes before a futures settlement, often reflects a single large order hitting an empty book rather than genuine directional displacement.
- Reject setups with inadequate reward-to-risk. Measure the distance to your invalidation and the distance to the nearest realistic target before entry. If the ratio is below 1.5:1 after costs, skip it. No exceptions for setups that “look clean.”
Filters that eliminate 70% of detected gaps are normal.
The remaining 30% is where you work.
Entry Models Compared
Take one consistent example: a bullish FVG on EUR/USD spanning 1.0820 to 1.0840, so a 20-pip zone with a midpoint at 1.0830. The structural swing low sits at 1.0805.
Four ways to enter, four different trade profiles.
| Entry Model | Entry Price | Stop / Risk | Trade-Off |
|---|---|---|---|
| First touch (zone edge) | 1.0840 | 1.0800 / 40 pips | Best price and highest R potential, but lowest hit rate. Many touches keep going. |
| Midpoint / consequent encroachment | 1.0830 | 1.0800 / 30 pips | Balanced. Skips the shallowest touches but misses trades that reverse from the edge. |
| Confirmation (reaction candle close) | 1.0845 | 1.0815 / 30 pips | Highest win rate, worst price. You pay for evidence and sometimes arrive after the move. |
| Continuation (after structure shift) | 1.0860 | 1.0828 / 32 pips | Requires a confirmed market structure shift. Fewest signals, cleanest context. |
Notice what changes and what doesn’t.
The first-touch entry offers the largest reward-to-risk ratio on paper and the most frequent stop-outs in practice. Confirmation entries feel safer and deliver measurably fewer opportunities.
One correction to a widespread belief: the 50% midpoint is a convention, not a law.
Consequent encroachment gained popularity because it’s a convenient split, not because markets recognize halfway points.
Test 33%, 50%, and 66% on your own instrument. The optimal level varies by market and timeframe, and on some instruments the difference is negligible.
Stops, Targets, and Trend Direction
Risk placement is where a marked zone becomes an actual trade with an actual loss limit.
- Place the stop beyond structural invalidation, not beyond the zone. For a bullish gap, that means below the swing low that created the displacement. If that swing breaks, your directional premise is dead regardless of where the gap sits.
- Add a volatility buffer. Roughly 0.25 to 0.5 ATR beyond the structural point keeps you clear of routine wick hunts. Tight stops on a 20-pip zone are how traders get stopped out and then watch the trade work perfectly.
- Target the next liquidity pool. Prior session highs and lows, equal highs, and obvious swing points attract price because resting stops cluster there. These are the most defensible targets on a chart.
- Or target the opposing imbalance. An unmitigated bearish FVG above your long entry is a logical exit zone, since price frequently stalls where the opposite inefficiency sits.
- Or use a fixed R multiple. Exiting at 2R mechanically removes discretion and makes your expectancy math trivially easy to calculate. Less elegant, far easier to test.
- Resolve timeframe conflicts in favor of the higher timeframe. When a bullish 5-minute FVG forms inside a bearish 4-hour imbalance, either skip it or wait for the higher timeframe to shift. Multi-timeframe analysis exists to veto trades, not to manufacture confluence for ones you already want.
The last rule saves more accounts than any entry refinement ever will.
Backtesting, Costs, and Automation
A pattern that looks obvious in hindsight and a pattern that makes money are different things. The gap between them is mostly methodology and transaction costs.
Avoiding Lookahead Bias
Lookahead bias is the use of information that wasn’t available at the moment of decision.
It’s the single most common reason backtested FVG strategies collapse in live trading.
Three specific traps.
First, detecting the gap before candle 3 closes. The three-candle pattern is only confirmed on that close, so any entry logged at candle 3’s open is fiction.
Second, resolving whether a stop or target hit first using a candle’s high and low without knowing the intrabar sequence. On a 4-hour bar that touched both, your backtest just guessed, and it probably guessed in your favor.
Third, running the study on coarse data.
Testing an H1 strategy with H1 candles hides the real path price took.
Drop to 1-minute data for trade resolution even when signals come from higher timeframes. It’s slower and it’s the only honest way to do it.
Spread, Slippage, and News
Costs scale inversely with gap size, which is exactly the wrong direction for intraday traders.
Consider a 6-pip FVG on a 1-minute chart with a 1.2-pip spread and 0.3 pips of average slippage.
You’ve surrendered 25% of the zone before price moves.
Add commission and the setup needs a substantially higher win rate than the chart suggests just to break even.
Now run the same logic on a 45-pip daily gap. Identical costs, but they represent roughly 3% of the zone.
Same pattern, completely different economics.
This is why many traders find that fair value gap trading only shows positive expectancy above a certain timeframe on their specific broker.
Volatility around scheduled news deserves its own caution.
Displacement candles during high-impact releases produce oversized gaps that look impressive and behave unpredictably, partly because the recorded prices themselves are unreliable when spreads triple.
Flag news windows in your data and test those setups as a separate cohort. They frequently have a different profile entirely.
Where an Indicator Fits (PipTrend Example)
Manually marking every three-candle imbalance across several instruments is tedious, and tedium produces inconsistency.
You’ll mark the gaps that support your bias and skim past the ones that don’t.
Automated detection fixes that specific problem.
A tool like PipTrend applies the three-candle rule identically every time, marks zone boundaries to the tick, tracks mitigation status as price returns, and presents a 12-timeframe confirmation table so higher-timeframe conflicts are visible before you click buy.
Be clear about the limit.
Automation improves the consistency and speed of detection.
It cannot judge whether a gap formed into opposing structure, whether the session had genuine liquidity, or whether the pattern carries predictive value on your instrument.
Those remain your decisions, and no indicator will make them for you.
Which brings us to the journal, the least glamorous and most valuable part of this entire process.
| Field | What to Record | Why It Matters |
|---|---|---|
| Instrument & session | EUR/USD, London open | Reveals which markets and hours actually carry your edge |
| Timeframe & gap size | M15, 14 pips, 0.8 ATR | Identifies the size threshold below which costs dominate |
| Trend direction | H4 bullish, aligned | Separates with-trend from counter-trend performance |
| Liquidity event | Swept prior day low first | Tests whether a liquidity sweep before the gap improves outcomes |
| Entry model | Midpoint / CE | Lets you compare models on identical setups |
| Maximum adverse excursion | -0.6R before turning | Shows whether your stops are too tight or wastefully wide |
| Fill outcome & net result | Full fill, +2.1R after costs | Feeds directly into expectancy calculation |
Fifty logged trades across these fields will tell you more than fifty hours of reading.
The data is specific to you: your broker, your instrument, your discipline.
Fair Value Gap Trading FAQs
What is a fair value gap in trading?
A fair value gap is a three-candle price imbalance where the low of the third candle sits above the high of the first candle (bullish), or the high of the third candle sits below the low of the first candle (bearish), leaving a range of prices that never traded across overlapping candles.
The middle candle is the displacement bar that creates the void. The zone is measured wick to wick between candles 1 and 3, and it remains marked on the chart until price returns and mitigates it.
How do you trade a fair value gap?
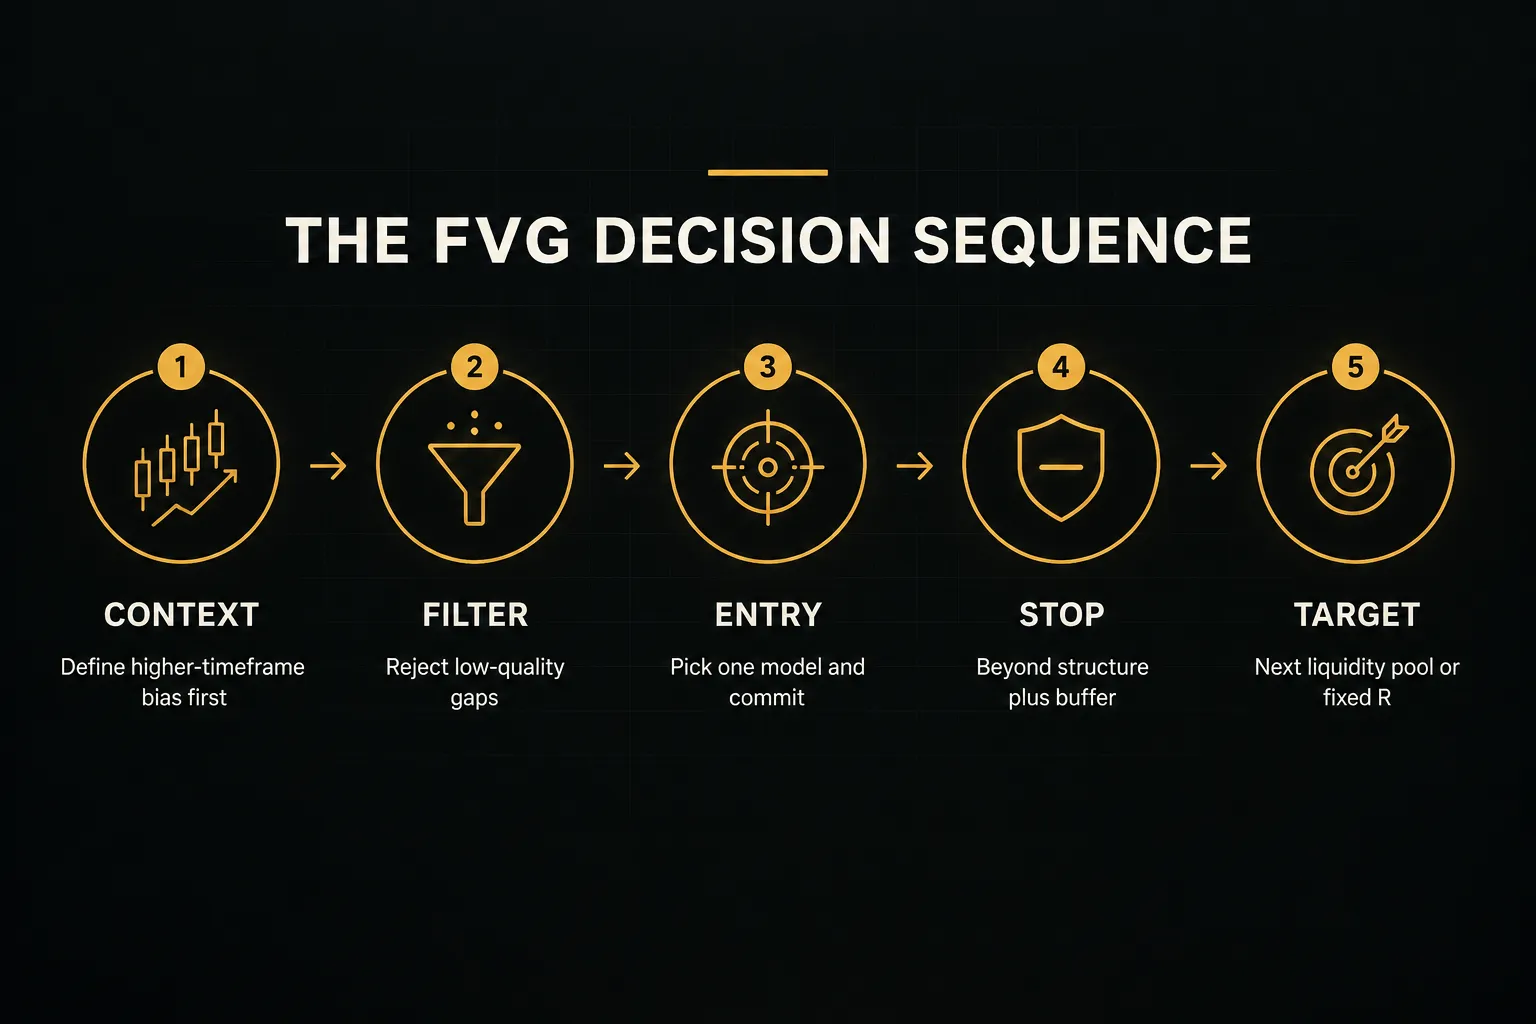
You trade it in four ordered steps: establish higher-timeframe context, filter out low-quality gaps, choose a single entry model, then define stop and target before entry.
Context means confirming the gap aligns with the dominant trend and sits in a sensible premium or discount location. Filtering removes gaps that are too small relative to ATR, formed during news, or point against higher-timeframe structure.
Entry is first touch, midpoint, or confirmation candle, chosen in advance and applied consistently. The stop sits beyond structural invalidation with a volatility buffer, and the target is typically the next liquidity pool or a fixed R multiple.
What is the success rate of fair value gap trading?
There is no universal success rate, and any specific figure quoted without full methodology should be treated as marketing.
Results depend entirely on the instrument, timeframe, filter set, entry model, stop distance, and transaction costs.
A confirmation-entry model on daily charts and a first-touch model on 1-minute charts are different strategies that happen to share a pattern name.
Generate your own number by backtesting your exact rules on your own broker’s data, including spread and slippage, across at least 100 occurrences.
Do fair value gaps always fill?
No.
Fill outcomes depend entirely on how you define mitigation and how long you’re willing to wait.
Under a loose wick-touch definition with an unlimited observation window, fill rates look extremely high because most price levels get revisited eventually. Under a strict close-through definition within a 20-candle window, the same dataset produces a dramatically lower figure.
Plenty of gaps on any chart remain unfilled for months or permanently.
“Always” is a claim, not a statistic.
What is the best timeframe for FVG trading?
The best timeframe is the one that matches your holding period and survives your transaction costs.
Day traders typically work with 1-minute to 15-minute charts, accepting frequent signals and a heavier cost burden relative to gap size.
Swing traders use 4-hour and daily charts, where gaps are larger, spread becomes a rounding error, and setups need days rather than minutes to resolve.
As of 2026, most retail traders find the M15 to H4 range offers the practical middle ground: enough signals to gather data, enough gap size to absorb costs.
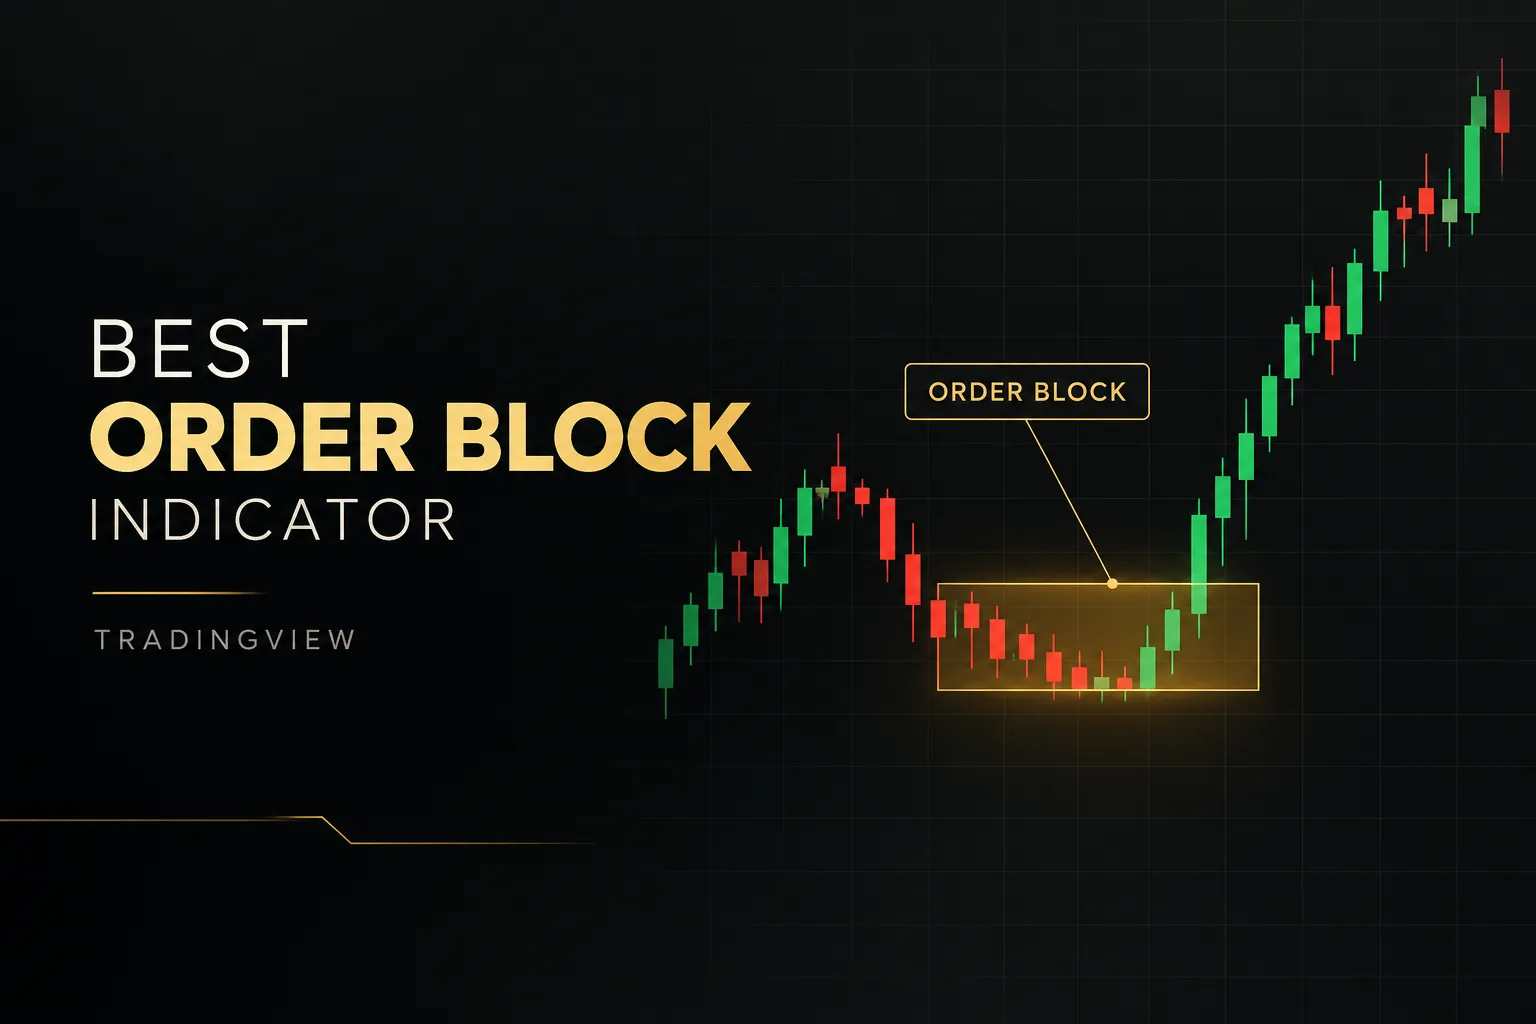
What is the difference between a fair value gap and an order block?
A fair value gap is a three-candle price imbalance; an order block is the last opposing candle before a displacement move. They’re related but not interchangeable.
An order block is a single candle (typically the final down candle before an aggressive rally, or the final up candle before a sharp decline). A fair value gap is the empty space that aggressive move left behind.
They frequently appear together, since the displacement that creates one often creates the other, and traders sometimes look for setups where the order block and the gap overlap.
But you can have either without the other, and the detection rules are completely separate.
The Bottom Line on FVG Trading
Here’s tonight’s assignment.
Pick one instrument and one timeframe.
Just one.
Mark the last 20 fair value gaps using the exact three-candle rule and a single pre-committed mitigation definition. Log entry price, invalidation, outcome, and maximum adverse excursion for each.
It takes about two hours and it will replace every opinion you’ve read with data that belongs to you.
Then decide honestly.
If a defined rule set shows positive expectancy across a meaningful sample, trade it at minimum size and scale slowly as the sample grows. If it doesn’t, don’t force it because the pattern looks compelling on a chart.
Compelling and profitable are unrelated variables.
A fair value gap is a description of how price behaved during a moment of displacement.
Nothing more.
The edge, if there is one, lives in the filters, the entry model, the risk placement, and the discipline around them… not in the gap itself.
Sources
Risk Disclaimer: Trading involves risk. Past performance doesn't guarantee future results. Only trade with money you can afford to lose. PipTrend is a tool to assist your trading decisions, not financial advice.