How to trade support and resistance with rules
On this page
Why most support and resistance fails
Most traders draw the same horizontal lines and still lose money on them. The problem is rarely the level.
It’s the lack of rules around it.
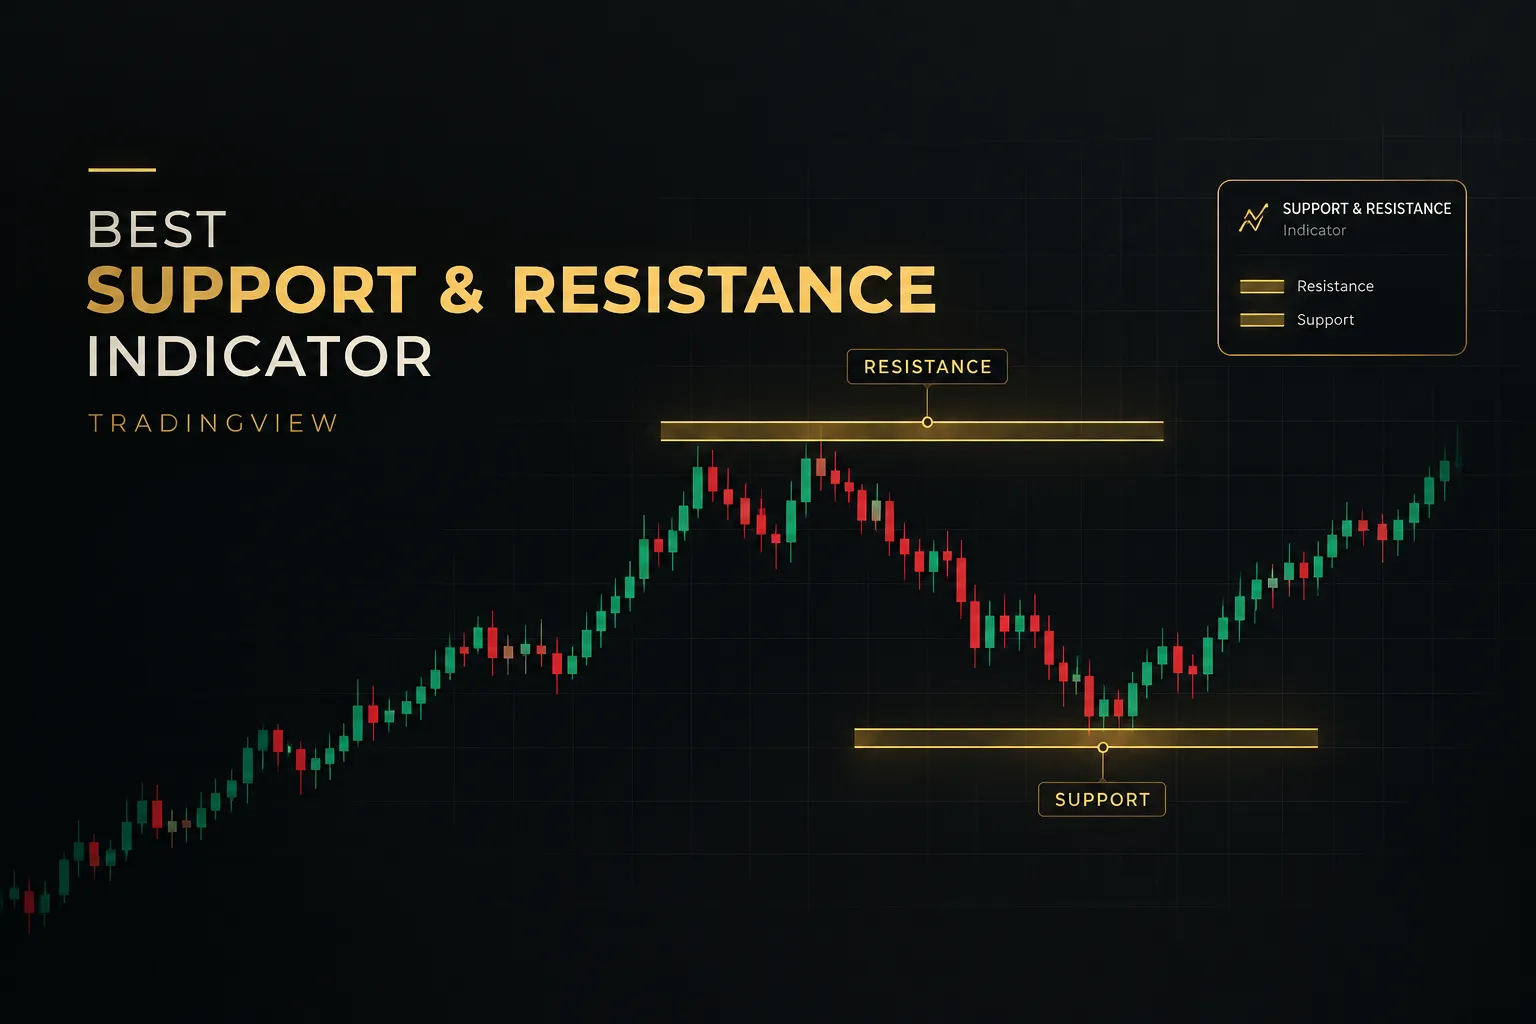
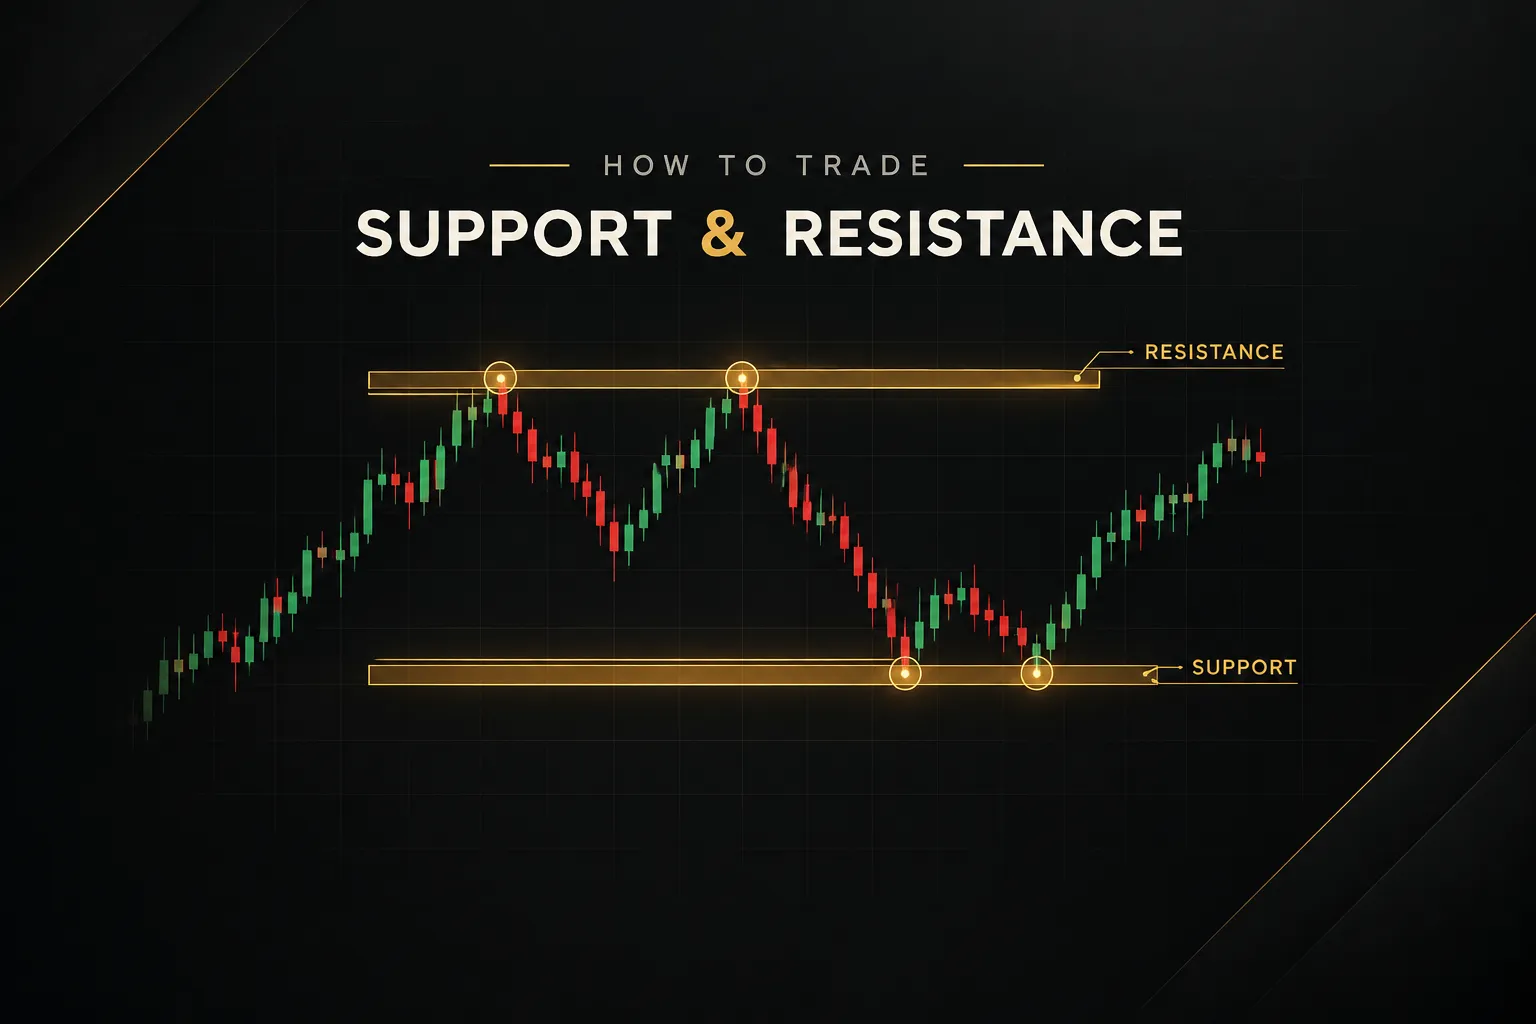
Support and resistance are zones of concentrated buying or selling interest.
Support is where demand has previously absorbed selling pressure. Resistance is where supply has previously capped rallies.
They are not magic lines that predict direction.
The most common mistake is treating every touch as confirmation. Traders keep adding lines until the chart looks like a barcode, and suddenly every candle sits near “a level.”
When everything is a setup, nothing is.
A level tells you where a reaction may occur. It never tells you that a hold or reversal will occur.
This guide gives you a repeatable, rules-based process for how to trade support and resistance in 2026. You’ll learn how to mark zones, check confluence, trigger entries, place stops, set targets, and filter out false breakouts.
Each step has an objective condition, so you can test it, journal it, and repeat it.
Reading the chart before you trade
Before any entry, you need to know what the level is, how strong it is, and what kind of market surrounds it.
Skip this, and the best entry trigger in the world won’t save the trade.
Why zones beat exact lines
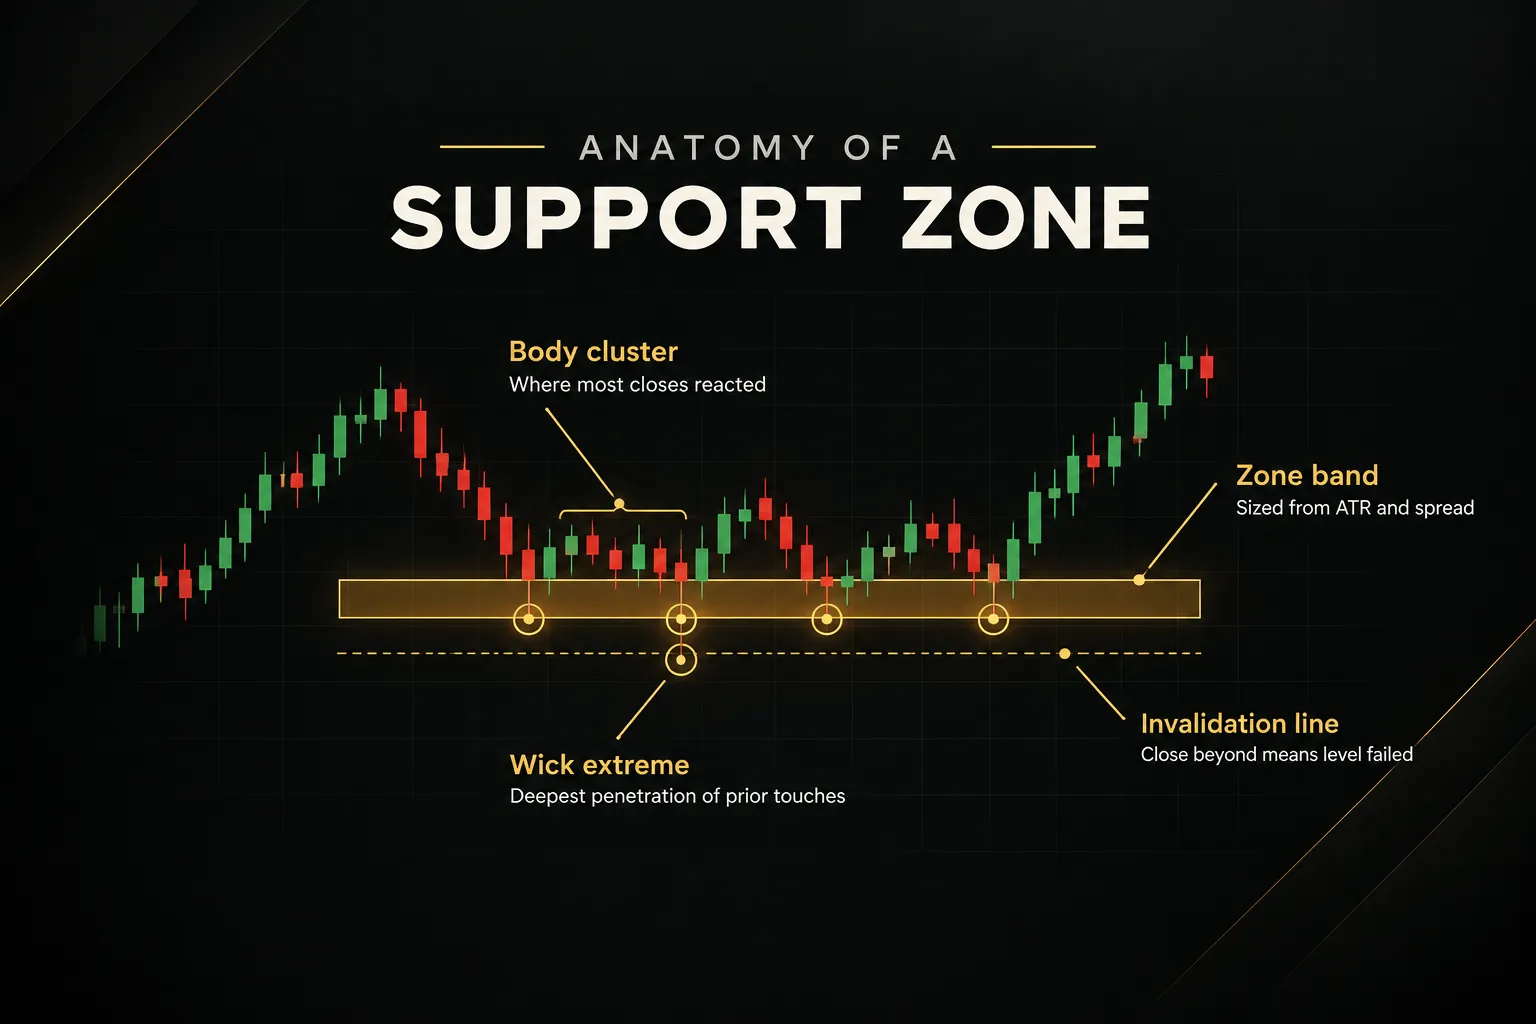
Price almost never turns at the exact tick you drew. Orders cluster around a level, so the reaction spreads across a band.
That’s why support and resistance zones outperform single horizontal lines in practice.
Zone width should come from three inputs: ATR volatility, the spread, and how far wicks typically penetrate the level. A practical starting point is 0.25 to 0.5 times the 14-period ATR on the timeframe where you drew the level.
Then widen it if prior wicks consistently poked further.
That produces very different widths across markets.
On a daily EUR/USD chart, a zone might span 15 to 30 pips. Large-cap stocks often need 0.5% to 1.5% of price, Bitcoin frequently needs 1% to 3%, and E-mini S&P 500 futures might need 5 to 15 points.
Draw the band from the cluster of candle bodies to the extreme wicks, not from one random high.
How touches strengthen or weaken levels
Conventional wisdom says more touches make a stronger level.
Sometimes.
A touch that produces a sharp, visible rejection (a long wick and a strong close away from the zone) confirms that real orders are still sitting there.
But repeated touches with shrinking reactions tell a different story. Each visit absorbs resting orders, much like waves eroding a sea wall.
Three weak bounces followed by price grinding back into the zone often signals a break is coming, not a fourth bounce.
Judge each touch by the quality of the reaction, not the count.
Fast, decisive departures add strength. Slow, overlapping candles that hug the zone subtract it.
Marking levels top-down
Multi-timeframe analysis keeps your chart clean. Start on the weekly and daily charts and mark only the obvious swing highs and swing lows where price turned with conviction.
Most traders need no more than three or four zones above and below current price.
Then drop to the 1H or 15M chart.
Not to find new levels.
You use the lower timeframe only to time entries at the higher-timeframe zones you already marked.
Context changes how a level reads.
In an uptrend, market structure favours support holding and resistance breaking. In a downtrend, the opposite. In a range, both edges tend to hold until they don’t, and during a high-volatility news spike, levels can be blown through and reclaimed within minutes.
Identify the market regime first, then decide which side of the level you’re willing to trade.
Three ways to trade a level
Every level offers three trades: the bounce, the breakout, and the retest. Each needs its own trigger and its own invalidation rule.
Mix them up, and you’ll end up buying a breakout while your stop sits where a bounce trade would put it.
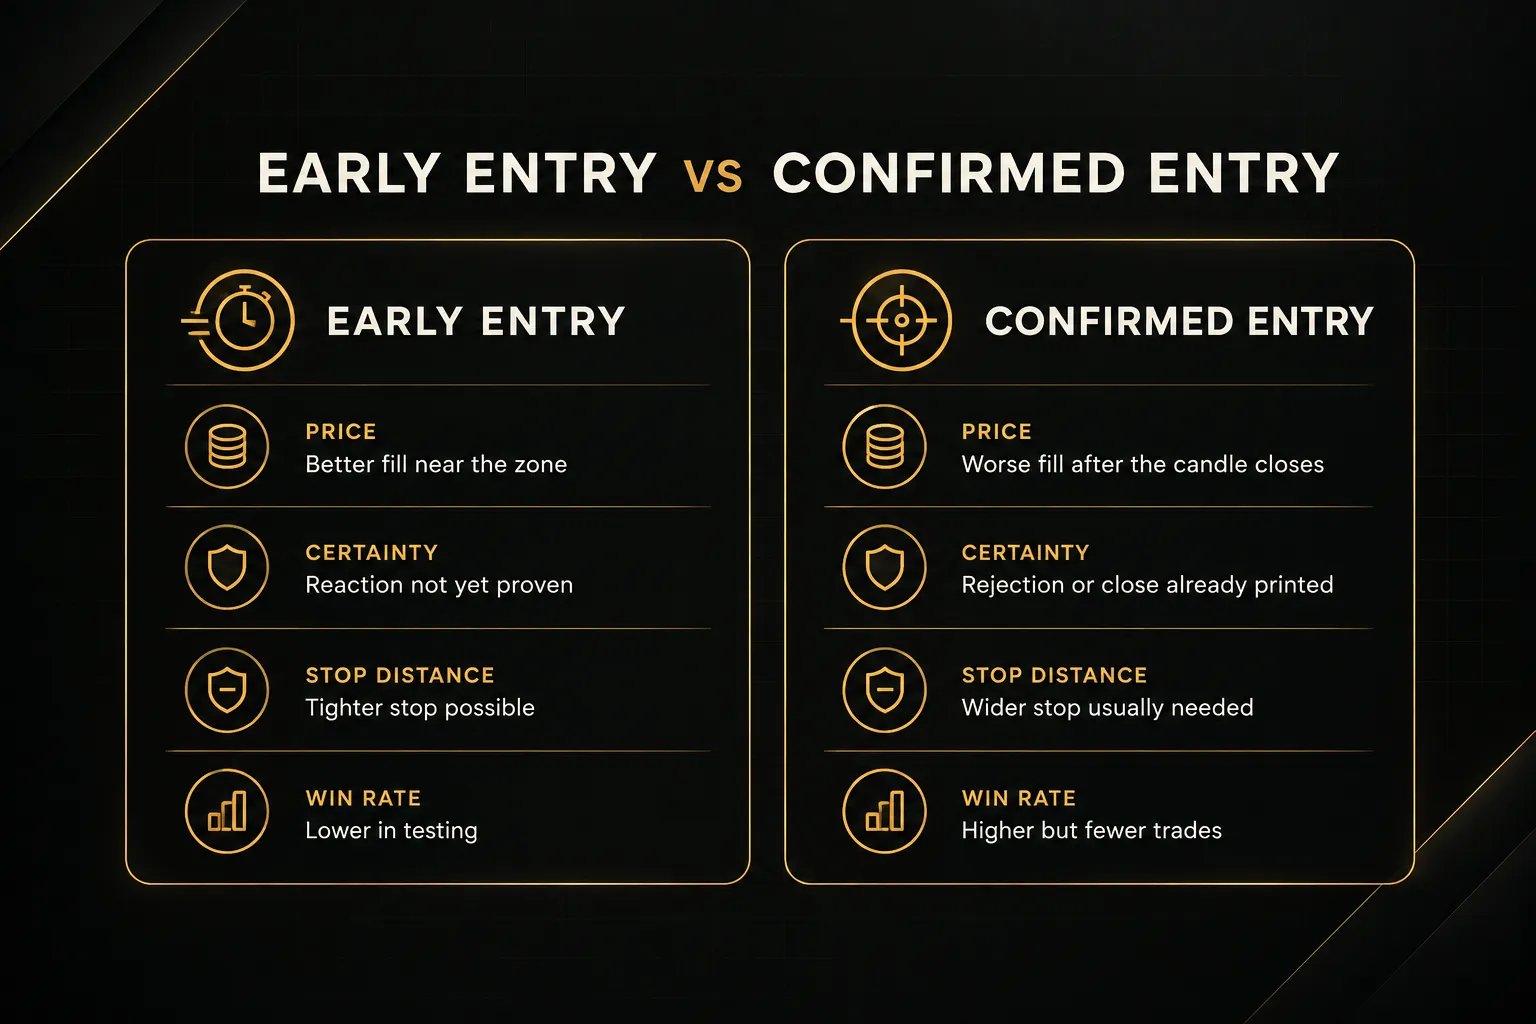
There’s also a trade-off running through all three. Entering early gets you a better price but more uncertainty. Waiting for confirmation improves your odds but costs you a worse entry and a lower risk-to-reward ratio.
Pick one approach per setup type and stick to it.
Bounce trades at a level
Bounce trades work best in ranges and at higher-timeframe zones that have not been heavily tested. The trigger must be objective, not a feeling that price “looks like it wants to turn.”
- Wait for price to enter the zone. Do not place limit orders blindly at the edge; let price actually trade into the band you marked.
- Look for a candlestick rejection. On your entry timeframe, you need a candle that wicks into the zone and closes back inside the range, such as a pin bar or bullish engulfing at support.
- Enter on the close or on a break of the rejection candle. Entering on the close is faster; entering on a break of its high (for longs) adds one more layer of confirmation.
- Define invalidation before entry. If a candle closes fully through the zone on your entry timeframe, the bounce thesis is dead and you exit, no exceptions.
Breakout and false-breakout signals
Here’s the uncomfortable truth: many breakouts are designed to fail.
Price pokes through a level, triggers stops and breakout orders, then reverses. This is a liquidity sweep, and it’s why breakout traders need stricter rules than bounce traders.
- Require a candle close beyond the zone. An intrabar wick through the level is not a breakout; only a close outside the full zone width counts as breakout confirmation.
- Check the size of the breakout candle. A close beyond the zone with a body of at least 0.5 to 1 times ATR shows real participation, while a tiny close just past the edge often fails.
- Filter out news spikes. If the break happens in the first few minutes after a major release (CPI, NFP, a central bank decision), treat it as unconfirmed until price holds for at least one more closed candle.
- Watch for a quick reclaim. If price closes back inside the zone within one to three candles, you’re looking at a false breakout, and that reclaim itself can become a trade in the opposite direction.
Retest entries after a breakout
The retest is often the cleanest of the three.
After a genuine break, old resistance tends to become new support, and old support becomes new resistance. Traders call this role reversal.
- Confirm the original breakout first. Use the closing rules above; no confirmed break, no retest trade.
- Wait for price to return to the broken zone. This pullback often happens within 3 to 15 candles on the entry timeframe, though some breaks never retest at all.
- Enter on the retest candle’s rejection. For a long, you want a candle that dips into the old resistance zone and closes back above it; enter on that close or on a break of its high.
- Invalidate on a close back through the zone. If price closes back inside the original range, the breakout has failed and the retest trade is over.
Managing risk at the level
A great level with bad risk management is still a losing strategy.
The level tells you where to look.
Your stop, size, and target decide whether the trade is worth taking at all.
Placing your stop-loss
Arbitrary stops (“I always use 20 pips”) ignore the market you’re trading. Good stop-loss placement sits where your trade idea is proven wrong, plus a buffer for normal noise.
- Start at the far edge of the zone. For a long at support, your reference point is the bottom of the zone, not the middle.
- Add an ATR buffer. Place the stop 0.25 to 0.5 times the entry-timeframe ATR beyond the zone edge so routine wicks don’t knock you out.
- Cross-check with structure. If a recent swing low sits just beyond your ATR-based stop, place the stop beyond that swing instead.
- Account for spread. On short positions especially, add the typical spread so your stop isn’t hit by the ask price while the chart’s bid never touched it.
Sizing the position correctly
Position sizing converts your stop distance into a fixed dollar risk.
Wider stop, smaller position.
Same risk every time.
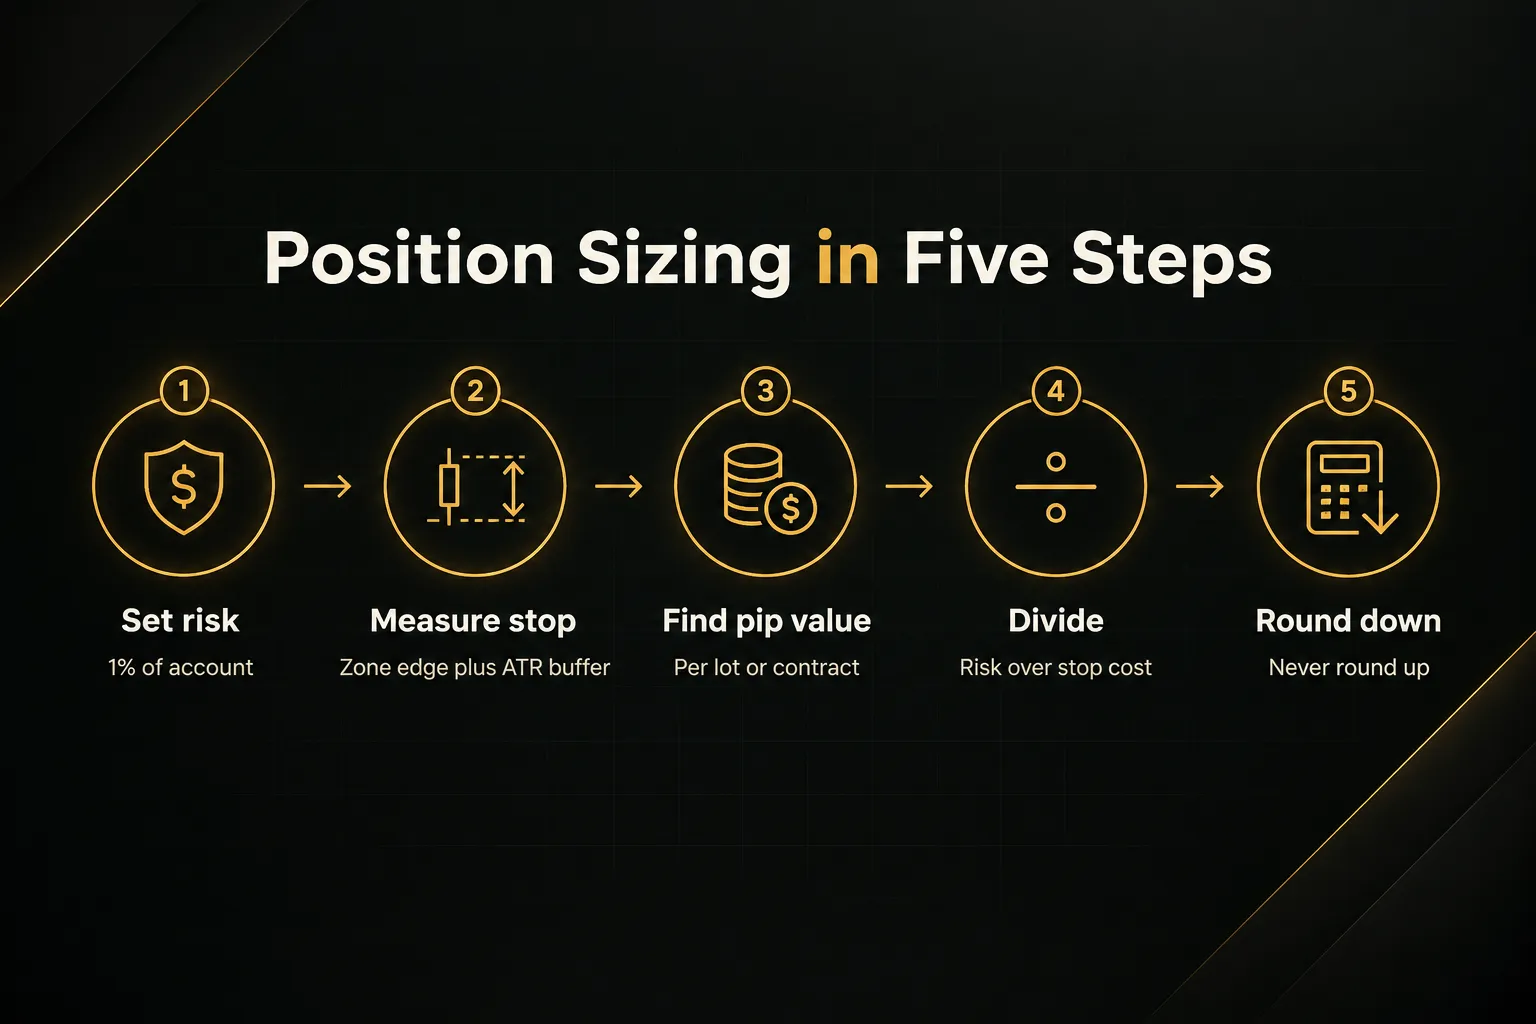
- Set account risk. With a $10,000 account and 1% risk per trade, your maximum loss is $100.
- Measure stop distance. Say EUR/USD support sits at 1.0850 to 1.0865, you enter at 1.0880, and the 1H ATR is 12 pips; a 6-pip buffer puts your stop at 1.0844, which is 36 pips away.
- Find the pip value. On EUR/USD, one standard lot (100,000 units) is worth about $10 per pip.
- Calculate size. $100 divided by (36 pips × $10) equals 0.277 lots, so you round down to 0.27 lots.
- Apply the same logic to futures. One E-mini S&P 500 contract is $50 per point, so an 8-point stop risks $400 (too much for this account), while the Micro E-mini at $5 per point risks $40 per contract, allowing 2 contracts for $80 total risk.
Setting realistic profit targets
Your take-profit target is usually the next opposing zone.
And that zone is often what kills an otherwise beautiful setup.
- Locate the next opposing zone. Using the example above, suppose resistance sits at 1.0940 to 1.0955.
- Target just before it, not inside it. Price often reacts at the near edge, so a target of 1.0935 gives 55 pips of potential profit.
- Calculate reward-to-risk. 55 pips of reward against 36 pips of risk is roughly 1.5R; if your rules demand 2R minimum, this trade is a pass, no matter how clean the bounce looks.
- Adjust for execution risk. Slippage, widening spreads, weekend gaps, and fast markets can turn a 36-pip stop into a 45-pip loss, so check whether the trade still makes sense with that effective stop distance.
A clean level with no room to the next zone is not a setup. It’s a coin flip with a cost attached.
Confirming levels without guesswork
Confirmation tools are useful.
They are also the easiest way to fool yourself.
The goal is to add one independent piece of evidence, not to stack indicators until you feel brave.
Volume, candles, and moving averages
Volume confirmation works differently depending on the market.
Spot forex has no central exchange, so there is no true market-wide volume figure for a market the BIS 2025 Triennial Survey sized at roughly $9.6 trillion a day. What you see on a forex chart is tick volume (the number of price changes) or broker-reported volume from one liquidity pool.
Futures are different.
Exchange-reported volume on CME contracts reflects actual traded size, which makes a volume surge on a breakout far more meaningful. Stocks sit in between, with consolidated volume that is reliable but fragmented across venues.
Beyond volume, three tools earn their place.
A candlestick rejection (pin bar, engulfing, or a long-wicked close back inside the zone) shows the reaction in real time. RSI divergence at a level, where price makes a lower low but RSI makes a higher low, shows fading momentum.
A 50- or 200-period moving average sitting inside the zone adds confluence.
But here’s the catch.
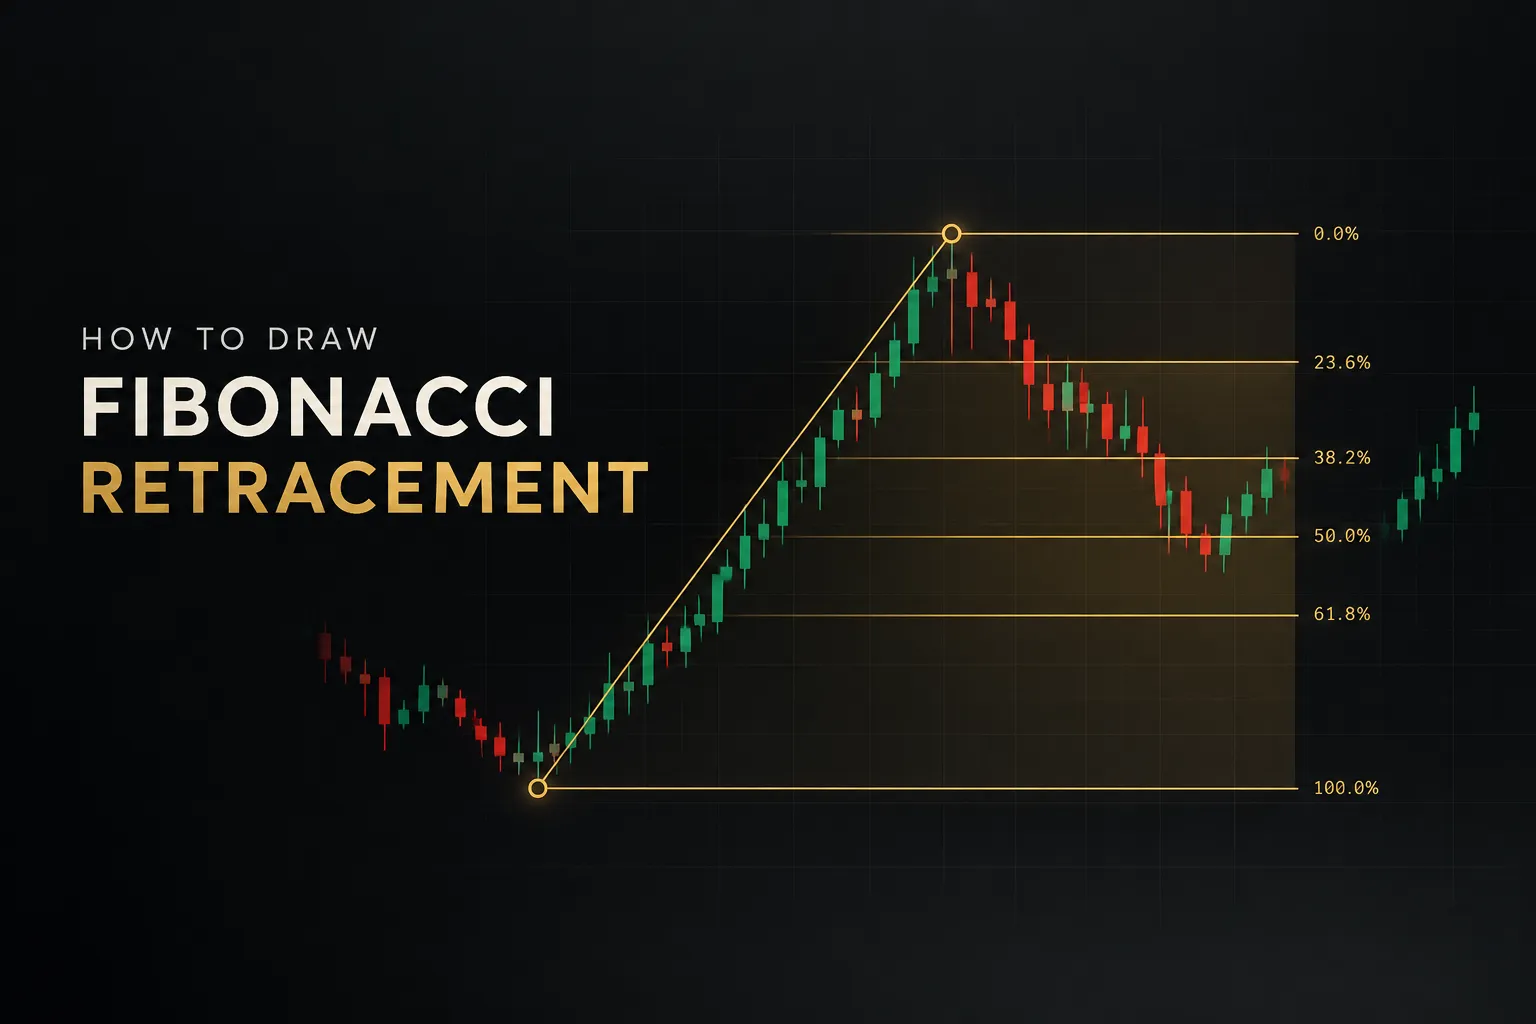
A level backed by structure, a moving average, a Fibonacci retracement, and an RSI reading is still one setup. Those tools often reflect the same underlying price history, so they are not four independent confirmations.
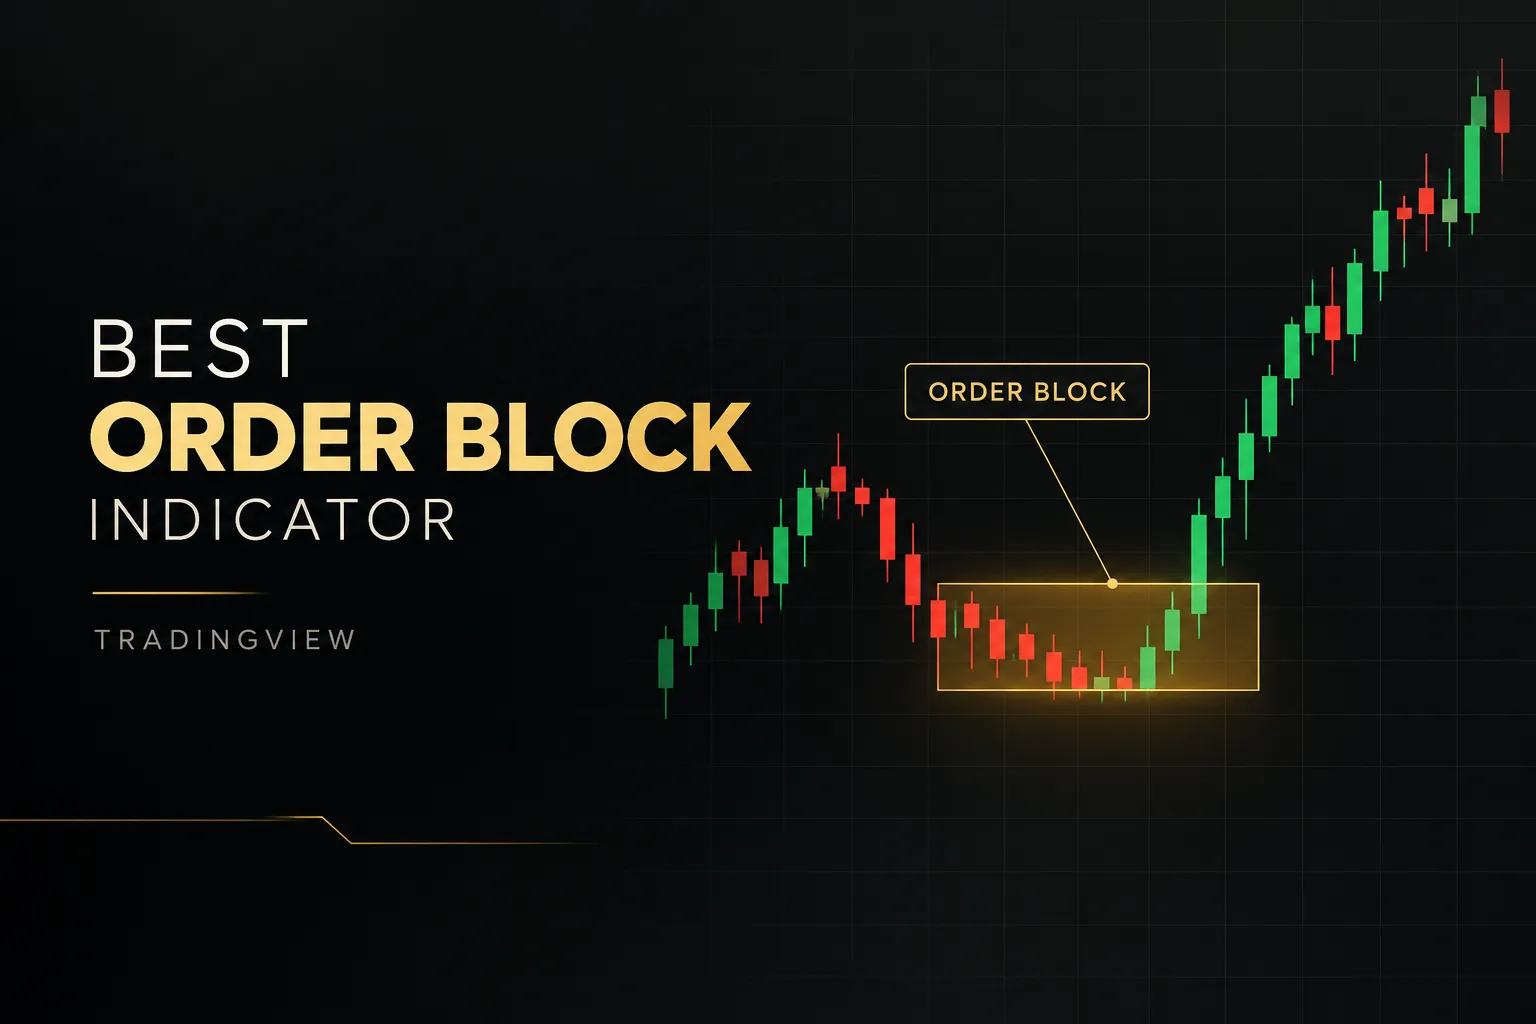
Tools like PipTrend handle this by separating two jobs. The trend filter decides direction, while the entry comes from an actual level such as a session high or low, VWAP, or a supply and demand zone.
The indicator filters the setup.
It doesn’t fire blind entries.
When indicators mislead you
Some indicators repaint, meaning past signals change after new candles form. A backtest on a repainting tool looks spectacular… and trades nothing like it live.
Always check whether a signal is fixed once its candle closes.
Others confirm late.
A moving average crossover may arrive after half the move is gone, which wrecks your reward-to-risk. Signals can also conflict across timeframes, with the 15M flashing a buy while the daily trend points down.
Then there’s overfitting.
Tweak enough settings and any indicator will fit historical data perfectly while failing on new data. Treat any single indicator as a filter, never as the whole strategy.
Backtesting and journaling levels
A trade journal turns opinions into evidence. For every trade, record eight fields: setup type (bounce, breakout, retest), timeframe, market regime, entry trigger, stop placement, target, outcome in R-multiples, and any execution error.
Run this template through backtesting on at least 50 to 100 historical examples per setup type. Then forward-test on a demo or small live account for several weeks.
Only go live with full size once both data sets agree.
The execution-error field matters most.
Many traders discover their setups are profitable and their mistakes (early entries, moved stops) are what’s losing money.
Common questions about support and resistance
How to trade support and resistance as a beginner
Beginners should follow a four-step sequence: mark higher-timeframe levels, wait for a reaction, confirm with one extra factor, then size the trade. Start on the daily chart and mark no more than three or four zones on each side of price.
When price reaches a zone, wait for a rejection candle or a confirmed break. Add one confirmation (momentum, volume, or a moving average), then calculate position size from your stop distance before you enter.
What’s the best indicator for support and resistance?
No indicator identifies support and resistance with certainty.
The best tools highlight zones (pivot points, VWAP, volume profile, session highs and lows) and filter market conditions such as trend direction. Confirmation still belongs to the trader, based on how price actually reacts at the zone.
How do you know a level will hold?
You never know for sure, but three signs raise the odds.
First, a clean prior reaction where price left the zone sharply.
Second, confluence with market structure or a key moving average.
Third, reduced momentum into the zone, shown by smaller candles or RSI divergence as price approaches.
What happens when support or resistance breaks?
A genuine break usually follows a pause, a retest, then continuation. Price closes beyond the zone, consolidates briefly, pulls back to test the broken level from the other side, and resumes.
A false break looks different: price pushes through, then reverses back inside the zone within one to three candles.
Should you buy at support, sell at resistance?
Buying support and selling resistance works best in ranges, not in strongly trending or newly broken markets. In a strong uptrend, resistance tends to break, so fading it means fighting the trend.
After a fresh break, the old level has changed roles, so the old playbook no longer applies.
How do you avoid false breakouts?
Avoid false breakouts by waiting for a candle close beyond the full zone, not just a wick. Check that volume or momentum supports the move, and avoid trading directly into major news releases.
If you still get caught, a fast close back inside the zone is your signal to exit immediately.
The one rule that matters most
A level only earns a trade when three things line up together: a clear price reaction, a logical stop placement, and an acceptable reward-to-risk.
Two out of three is a pass.
Here’s the single habit to start today.
Before your next trade, write down the zone, the invalidation point, and the target.
Before entering.
Not after.
That small act forces every rule in this guide into one decision. It also exposes the trades you only wanted to take because price was moving.
Support and resistance trading isn’t about predicting where price turns. It’s about responding the same way every time price reaches a zone.
Consistency, not prediction, is what separates a durable approach from guessing.
Sources
- New York Fed: Magic lines that predict direction
- New York Fed: Currency Orders and Exchange-Rate Dynamics: Explaining the Success of Technical Analysis - FEDERAL RESERVE BANK of NEW YORK
- FINRA: Slippage, widening spreads, weekend gaps
- CFTC: Customer Advisory: Eight Things You Should Know Before Trading Forex
- Fidelity: What Is Support And Resistance?
Risk Disclaimer: Trading involves risk. Past performance doesn't guarantee future results. Only trade with money you can afford to lose. PipTrend is a tool to assist your trading decisions, not financial advice.