On this page
The Problem With Blind Signal Following
A Discord alert pings: “BUY NVDA NOW.” A beginner hits the button within seconds. Ten minutes later the stock drops 2%, and they have no idea whether to hold, sell, or buy more.
That moment shows where most traders go wrong with stock trading signals. They copy the direction and skip everything else: where the entry was supposed to be, where the stop-loss sits, and what the exit plan looks like.
Without those details, the alert is just a guess you’ve borrowed from someone else.
This guide rests on one premise.
A usable signal is a framework with rules, not a guaranteed prediction. It tells you when the odds may tilt in your favor, what you’ll risk to find out, and when you’re wrong.
That’s all it can do, and that’s enough if you use it well.
Here’s what you’ll learn:
How signals are generated from technical analysis and price action. How to confirm them before acting.
How to measure whether a signal actually produces an edge over time. And how to spot the fraudulent signal services that flood social media.
One expectation needs setting up front.
No signal source, human or AI, can guarantee returns.
Both the CFTC and the SEC have issued repeated investor warnings about services promising consistent profits, and as of 2026 those warnings increasingly target AI-branded “trading bots.”
If someone promises certainty in markets, they’re selling something other than trading.
What a Trading Signal Actually Is
Most traders think they know what a signal is. Ask them to define it precisely, though, and the answers get vague fast.
A trading signal is a rule-based output that suggests a potential trade. It might come from an indicator, a chart pattern, or an algorithm.
The key word is rule-based: the same conditions should produce the same signal every time, regardless of who’s watching the chart.
That separates a signal from raw indicator data. A relative strength index reading of 28 is just a number.
“Buy when RSI crosses back above 30 while price holds above the 200-day moving average” is a signal, because it converts data into a specific, repeatable decision.
Indicator vs Alert vs Setup vs Signal vs System
These five terms get used interchangeably, and that confusion causes real losses. Each one sits at a different level of completeness.
An indicator is a calculation applied to price or volume, like MACD or Bollinger Bands. An alert is a notification that some condition was met, such as “price touched the upper band.”
A setup is a market context worth watching, like a stock consolidating near support and resistance after a strong trend.
A signal is the specific trigger that says “act now, under these terms.” A system is the full rulebook: which signals you take, how you size positions, how you manage trades, and when you stop trading altogether.
Think of it like cooking. The indicator is an ingredient, the setup is the recipe, the signal is the moment the pan is hot enough, and the system is the whole kitchen.
Anatomy of a Complete Signal
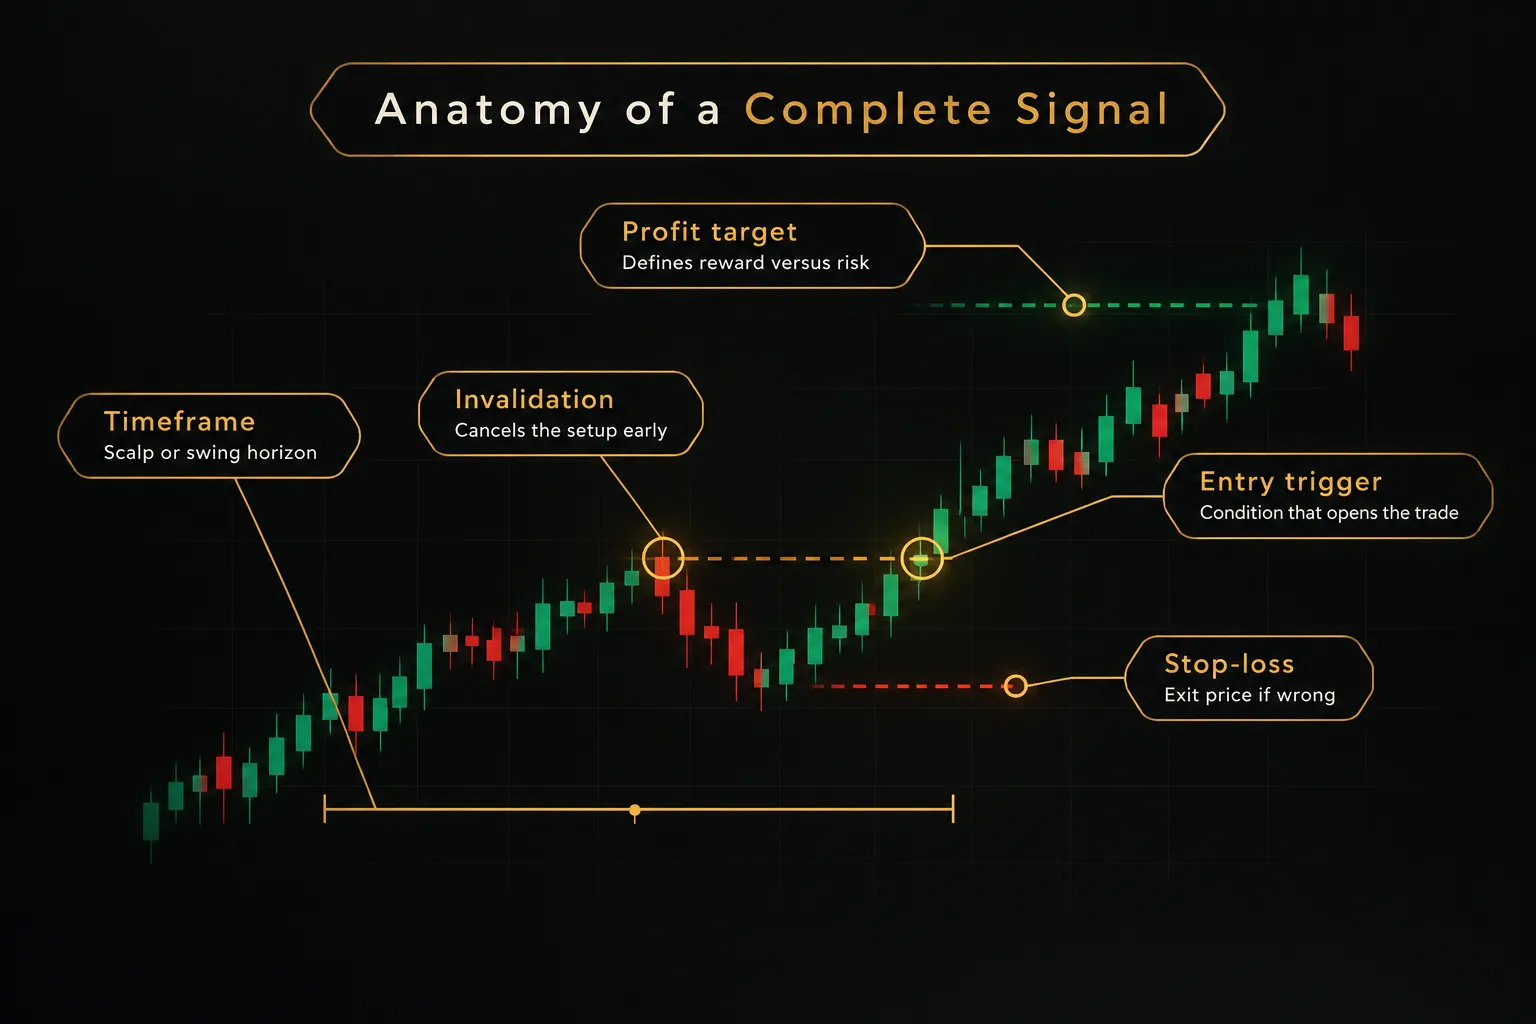
A complete, tradeable signal must specify five things.
Miss one and you’re improvising.
First, the entry trigger: the exact condition that opens the trade. Second, the stop-loss: the price where you exit if wrong.
Third, the profit target: where you take gains, which defines your risk-to-reward ratio. Fourth, the timeframe: whether this is a 5-minute scalp or a multi-week swing.
Fifth, and most often ignored, the invalidation condition.
This is the circumstance that cancels the signal before entry or forces an early exit even if the stop hasn’t been hit. For example, “If price closes below the breakout level within two sessions, the setup has failed.”
Most beginner guides stop at “buy” or “sell.” They skip invalidation and stop placement entirely.
That gap explains why so many traders misuse signals: they know when to get in but have no rules for getting out.
Signals vs Stock Tips
A stock tip says “this will go up.” A signal says “under these conditions, this trade has defined risk and a defined exit.”
The difference is accountability.
Tips are opinions, often unverifiable and frequently conflicted (the person sharing may already own the stock and want buyers). Signals, done properly, can be tested, measured, and rejected if they don’t perform.
If you can’t backtest it, it’s probably a tip wearing a signal’s clothing.
Where Signals Come From
Every indicator works beautifully in some conditions and fails badly in others.
The trick isn’t finding a perfect indicator. It’s knowing when your chosen one is likely to lie to you.
Most technical signals fall into two camps: trend following (betting the current move continues) and mean reversion (betting an overstretched move snaps back). Understanding which camp an indicator belongs to tells you a lot about where it breaks.
Popular Indicators and Their Blind Spots
Here’s how the three most widely used indicators generate signals, and when each tends to produce false ones:
- Relative Strength Index (RSI): RSI measures momentum on a 0 to 100 scale, with readings above 70 traditionally called overbought and below 30 oversold. It’s a mean reversion tool, so it fails in strong trends, where a stock can stay “overbought” for weeks while climbing another 20%.
- MACD: The MACD line crossing above its signal line suggests bullish momentum, and crossing below suggests bearish. Because it’s built from moving averages, it lags, and in choppy ranges that lag means crossovers fire right as the move is already reversing.
- Moving average crossover: The classic version is the 50-day crossing above the 200-day (the “golden cross”). It catches big trends well but generates repeated false signals during sideways chop, when the averages tangle together and cross back and forth.
- Bollinger Bands: Price touching the outer band can signal either exhaustion or breakout, depending on context. In a trending market, price “walks the band” for extended periods, punishing anyone who treats every touch as a reversal.
Confluence and Confirmation
One indicator is a hint.
Several independent factors pointing the same way is signal confluence, and it’s the closest thing traders have to a filter against noise.
- Trend direction: Check the higher timeframe first. A bullish signal on a 15-minute chart carries more weight when the daily chart is also trending up.
- Volume confirmation: Breakouts on below-average volume fail more often. Look for volume at least 1.5 times the recent average, or check whether price is holding above VWAP (volume-weighted average price) during the session.
- A meaningful price level: Signals near established support and resistance, prior highs, or gap levels give you a logical place for the stop. Signals in the middle of nowhere don’t.
- Candle close confirmation: Wait for the candle to close before acting. Mid-candle readings can flip completely before the bar finishes, a problem called repainting, and acting early is one of the most common causes of premature entries.
That last point deserves emphasis.
An RSI cross that appears at minute 3 of a 15-minute candle may vanish by minute 15.
Waiting costs you a slightly worse price. Not waiting costs you trades that never should have existed.
Sideways and Volatile Markets
The market regime (whether the market is trending, ranging, or volatile) matters more than which indicator you pick. Almost every popular tool struggles in two specific conditions:
- Sideways markets: Trend-following signals whipsaw constantly, triggering entries that reverse within a few bars. A moving average system can take five or six consecutive small losses in a range before the next real trend appears.
- High-volatility regimes: When the VIX spikes or a stock’s average true range doubles, normal stops get hit by noise alone. Signals that worked in calm conditions suddenly produce stop-out after stop-out.
- Regime transitions: The most dangerous moment is when a trend ends and chop begins. Your signals still look like the ones that worked last month, but the conditions underneath have changed.
Does a Signal Actually Work?
Would you take a strategy that wins 70% of the time? Most people say yes instantly.
They shouldn’t, at least not before asking one more question: how big are the losses?
Win Rate Isn’t Enough
Win rate tells you how often you’re right.
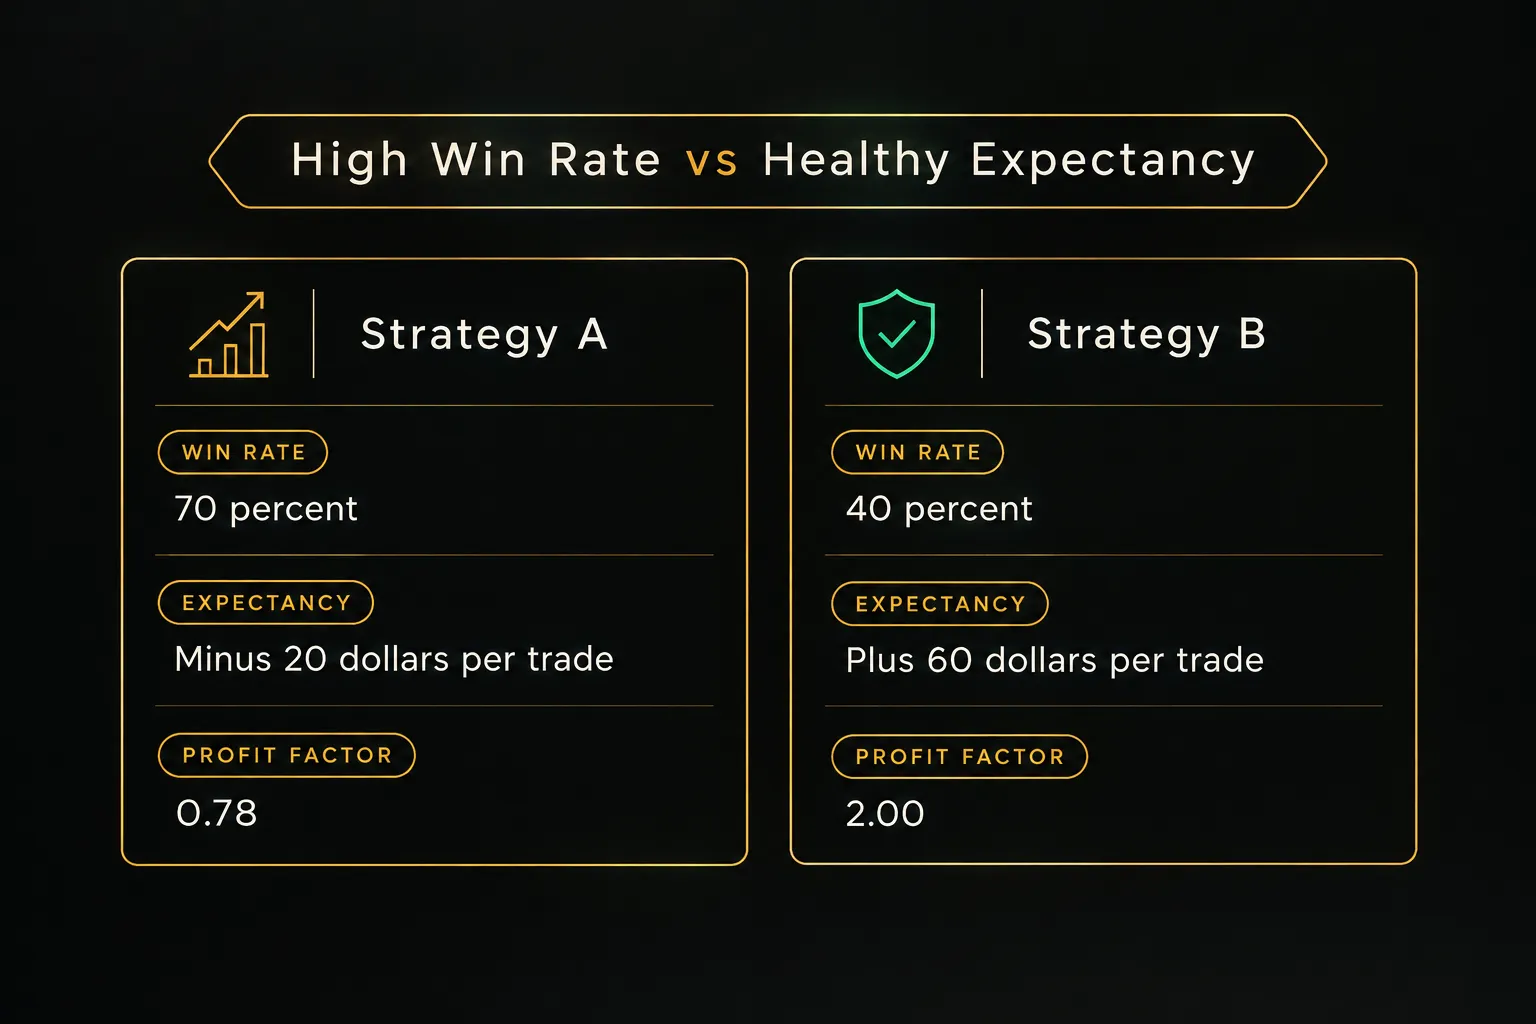
It says nothing about how much you make when right versus how much you lose when wrong. Plenty of 70% win-rate strategies lose money, and plenty of 40% strategies are excellent.
The metric that matters is trade expectancy: (win % × average win) minus (loss % × average loss). It tells you what you should expect to earn, on average, per trade. Two related measures complete the picture: profit factor (gross profits divided by gross losses, where anything above 1.0 is profitable) and maximum drawdown (the largest peak-to-trough decline in account value).
Here’s what that looks like with two hypothetical strategies over 100 trades, including the impact of slippage and transaction costs:
| Metric | Strategy A (High Win Rate) | Strategy B (Low Win Rate) |
|---|---|---|
| Win rate | 70% | 40% |
| Average win | $100 | $300 |
| Average loss | $300 | $100 |
| Expectancy per trade (before costs) | (0.70 × $100) − (0.30 × $300) = −$20 | (0.40 × $300) − (0.60 × $100) = +$60 |
| Profit factor | $7,000 ÷ $9,000 = 0.78 | $12,000 ÷ $6,000 = 2.00 |
| Expectancy after $10 round-trip costs | −$30 | +$50 |
| Net result over 100 trades | −$3,000 | +$5,000 |
Strategy A feels better to trade.
You win most days.
But it bleeds money because each loss wipes out three wins.
Costs make the gap worse.
Commissions may be near zero at many US brokers in 2026, but spreads and slippage aren’t. A strategy that trades small-cap stocks with a 10-cent spread and averages a 30-cent profit is giving away a third of its edge before it starts. Backtests that ignore these frictions routinely look 20% to 50% better than live results.
Backtesting and Forward Testing
A signal you haven’t tested is a hypothesis.
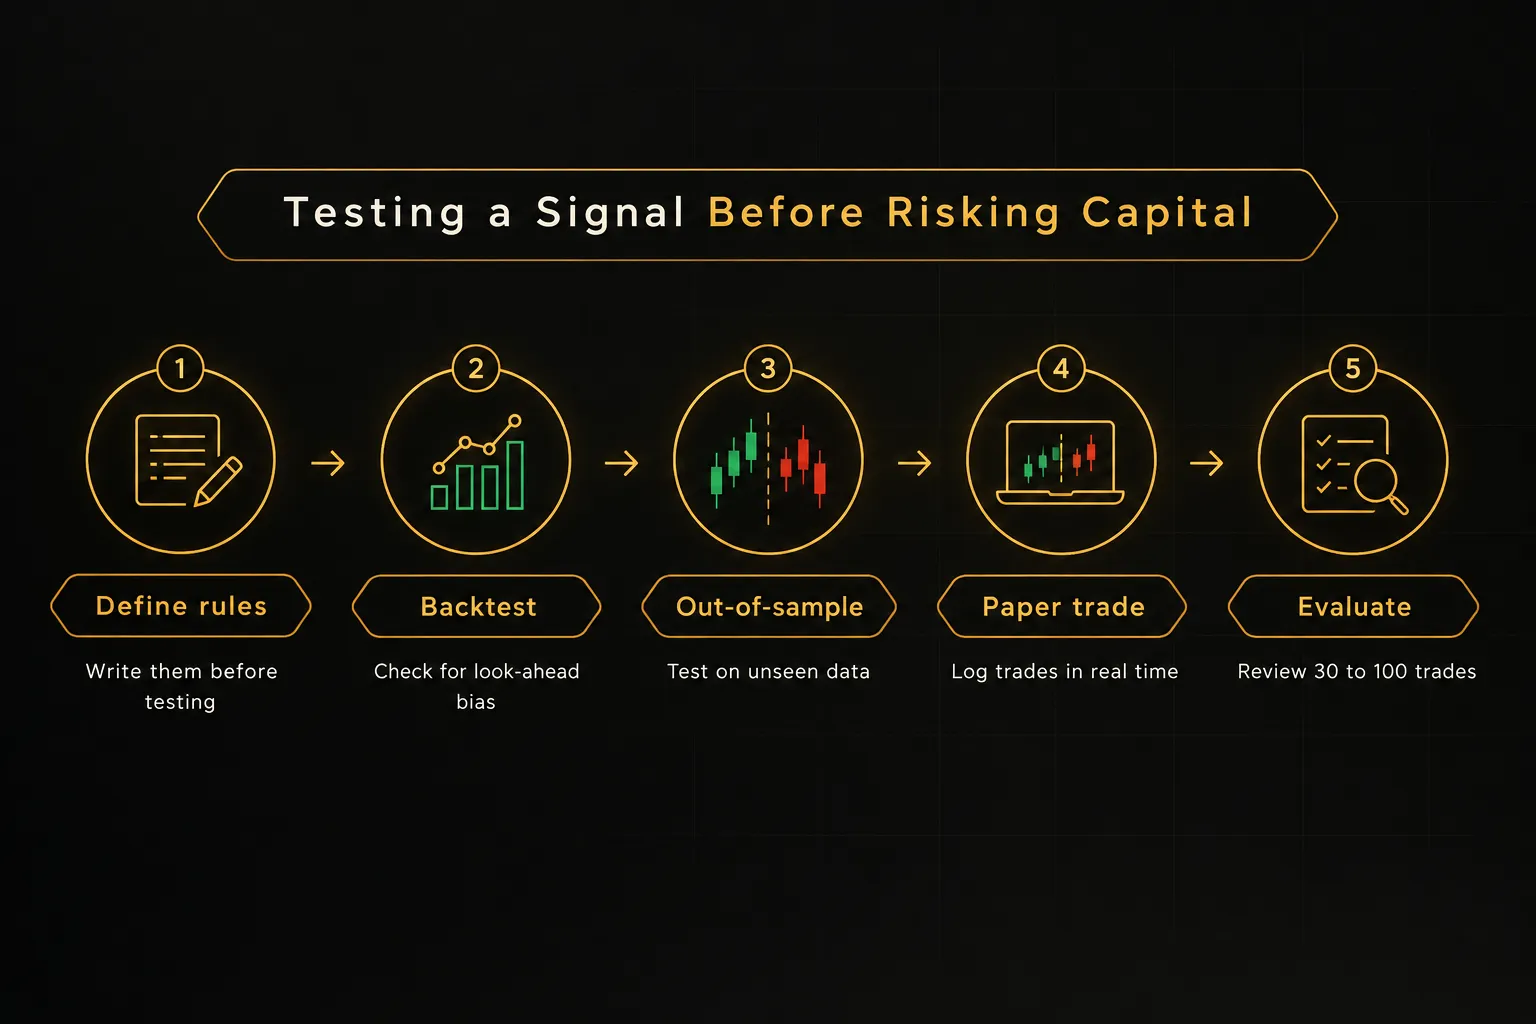
Here’s a basic process for turning it into evidence:
- Define exact rules first. Write down entry, stop, target, timeframe, and invalidation before looking at any results, so you can’t adjust rules to fit the data.
- Backtest on historical data. Run the rules across past charts, watching for look-ahead bias (using information that wasn’t available at the time, like a candle’s close before it closed) and hindsight bias (skipping trades that “obviously” wouldn’t work).
- Use out-of-sample testing. Hold back a portion of data, say the most recent 30%, and test on it only after finalizing rules. More advanced traders use walk-forward analysis, repeatedly optimizing on one window and testing on the next.
- Forward test in real time. Paper trade the signal live, logging every trade as it happens. This catches execution problems that backtests miss.
- Collect a meaningful sample. Aim for roughly 30 to 100 trades before drawing conclusions. Ten trades tells you almost nothing; luck dominates small samples.
Reading a Real Track Record
Anyone can post a screenshot of a winning trade. A trustworthy track record looks very different.
It includes timestamped entries published before the outcome was known. It’s backed by broker statements rather than spreadsheets the provider controls.
And it shows every losing trade, not just the highlights.
PipTrend’s public results page is one example of this transparency standard, publishing verified cTrader statements that include both winning and losing periods. Whatever service you evaluate, that’s the benchmark.
If a provider can’t show you something comparable, assume the numbers you’re not seeing are the bad ones.
Putting Signals Into Practice
A good signal with poor risk management will still blow up an account. A mediocre signal with disciplined sizing can survive long enough to improve.
The math of survival matters more than the math of prediction.
Stop-Loss and Position Sizing
Professional traders size positions by risk, not by conviction. The standard approach is fixed-percentage risk: you risk a set portion of your account, commonly 0.5% to 2%, on any single trade.
Here’s how it works on a $25,000 account risking 1%.
Your maximum loss per trade is $250. If the stock’s average true range (ATR) is $2.00 and you place your stop 1.5 ATR away, that’s $3.00 of risk per share, so you buy 83 shares ($250 ÷ $3.00).
Notice what drives the stop-loss placement: volatility, not an arbitrary dollar figure.
A stop set at “$1 below entry” might be sensible on a quiet utility stock and absurdly tight on a volatile biotech. ATR-based stops adapt to each stock’s normal movement, so you’re less likely to get shaken out by routine noise.
Proper position sizing also protects you from losing streaks. At 1% risk, ten consecutive losses cost about 10% of your account.
At 10% risk, the same streak leaves you down roughly 65%, a hole that requires a 186% gain to climb out of.
Stock-Specific Risks to Know
Most signal guides are written with forex or crypto in mind. Stocks carry risks those guides skip entirely.
Earnings gaps are the big one.
A stock can open 15% to 25% away from the prior close after an earnings report, jumping straight over your stop. Many systematic traders simply exit or avoid new positions in the days before earnings.
Overnight gap risk applies beyond earnings too. Analyst downgrades, FDA decisions, and macro news all hit between sessions, and your stop-loss order executes at the next available price, not the price you set.
And trading halts can freeze a stock entirely, sometimes for an hour or more, leaving you unable to exit at any price.
Low float and low liquidity names deserve special caution. Stocks with small share counts can move 50% in minutes on modest volume, and the bid-ask spread on thinly traded names can be several percent wide.
That spread is an immediate loss the moment you enter, and it often makes the signal’s theoretical edge disappear.
AI Signals and Red Flags
AI and automated signal tools have a genuine advantage: consistency. They apply rules the same way every time, don’t panic after three losses, and don’t chase trades out of boredom.
That removes much of the emotional error that sinks discretionary traders.
But automation has hard limits.
No model can predict a surprise earnings miss, a CEO resignation, or a sudden shift from trending to chaotic conditions.
Models trained on past regimes often fail precisely when the regime changes… which is exactly when you need them most.
The CFTC has specifically warned investors that AI cannot turn trading bots into money machines, and that claims of guaranteed returns from AI-powered trading are a hallmark of fraud.
Whether a service is human-run or AI-powered, watch for these red flags:
- Guaranteed profits or claims of “risk-free” returns. No legitimate provider says this.
- Fake or unverifiable testimonials, especially lifestyle photos of cars and vacations instead of trading statements.
- Unsolicited tips on social media or messaging apps, which the SEC flags as a common entry point for pump-and-dump schemes.
- Refusal to share a full timestamped record, including losses. Cherry-picked wins are a marketing tactic, not evidence.
- Urgency pressure, like “only 3 spots left” or “price doubles tomorrow.” Real edges don’t expire on a countdown timer.
Frequently Asked Questions
What is the most accurate stock trading signal?
No single stock trading signal is universally the most accurate. Performance depends on the market regime: trend-following signals like moving average crossovers do well in trending markets, while mean reversion signals like RSI extremes do better in ranges. Accuracy also matters less than expectancy, since a signal that’s right 40% of the time can outperform one that’s right 70% of the time.
What are the best indicators for buy and sell signals?
The most widely used indicators for buy and sell signals are RSI, MACD, moving averages, Bollinger Bands, and volume-based tools like VWAP. Each has known blind spots, so traders typically combine two or three that measure different things, such as trend plus momentum plus volume. Confluence with support and resistance levels improves reliability more than adding extra indicators of the same type.
Do trading signals really work?
Trading signals can work when they’re rule-based, tested, and paired with disciplined risk management. They fail when traders follow them blindly without a stop-loss, position sizing, or exit plan. A signal provides a statistical edge at best, never a guarantee, and that edge only shows up across dozens of trades rather than any single one.
How do you know when a stock is about to go up?
You can’t know for certain when a stock is about to go up. What technical analysis offers is probability: conditions like a breakout above resistance on strong volume, a higher-timeframe uptrend, and bullish momentum confirmation suggest the odds favor upside. Because those odds are never 100%, every trade needs a predefined stop-loss for when the setup fails.
What is the difference between a trading signal and an indicator?
An indicator is a calculation, while a trading signal is a decision rule. RSI, MACD, and moving averages are indicators that produce numbers or lines. A signal turns those readings into a specific trade with an entry trigger, stop-loss, profit target, timeframe, and invalidation condition.
Are stock signal services worth it?
Stock signal services are worth it only if they provide a verifiable, timestamped track record that includes losing trades. Even then, past results don’t guarantee future performance, and the signals must fit your account size and risk tolerance. Services that promise guaranteed profits or refuse to show full records should be avoided entirely.
Signals Are a Tool, Not a Promise
So, do stock trading signals actually work?
They do, but not the way most people hope.
The alert itself is the least valuable part.
A signal’s real value comes from what surrounds it: clear trade entry and exit rules, confirmation through confluence and candle closes, and risk management that keeps any single loss small.
Strip those away and even a statistically sound signal becomes a coin flip with extra steps.
Here’s one concrete action for your next trade.
Before you click buy, write down five things: the entry, the stop, the target, the timeframe, and the condition that would invalidate the setup.
Then paper trade it first, and log the result honestly, especially if it loses.
Do that for 30 trades and you’ll know more about your signal than any marketing page could tell you.
The SEC and FINRA both emphasize the same reality for investors in 2026: there are no guaranteed returns in markets. Consistency comes from process and discipline, not from finding the perfect signal.
The traders who last are the ones who treat every signal as a hypothesis to test, never as a promise to trust.
Sources
Risk Disclaimer: Trading involves risk. Past performance doesn't guarantee future results. Only trade with money you can afford to lose. PipTrend is a tool to assist your trading decisions, not financial advice.