
Imagine consistently catching market reversals and riding trends with confidence, simply by mastering two key levels on your chart. In 2026, support resistance trading remains the cornerstone of successful technical analysis, offering unmatched clarity for entries, exits, and risk management across all markets.
This guide will help you build a rock-solid foundation, from understanding the basics of support and resistance to applying advanced identification methods. You will discover actionable strategies, learn to avoid common mistakes, and gain expert tips to adapt as markets evolve. Ready to unlock a more confident and profitable trading journey? Let’s dive in.
Understanding Support and Resistance: The Foundation
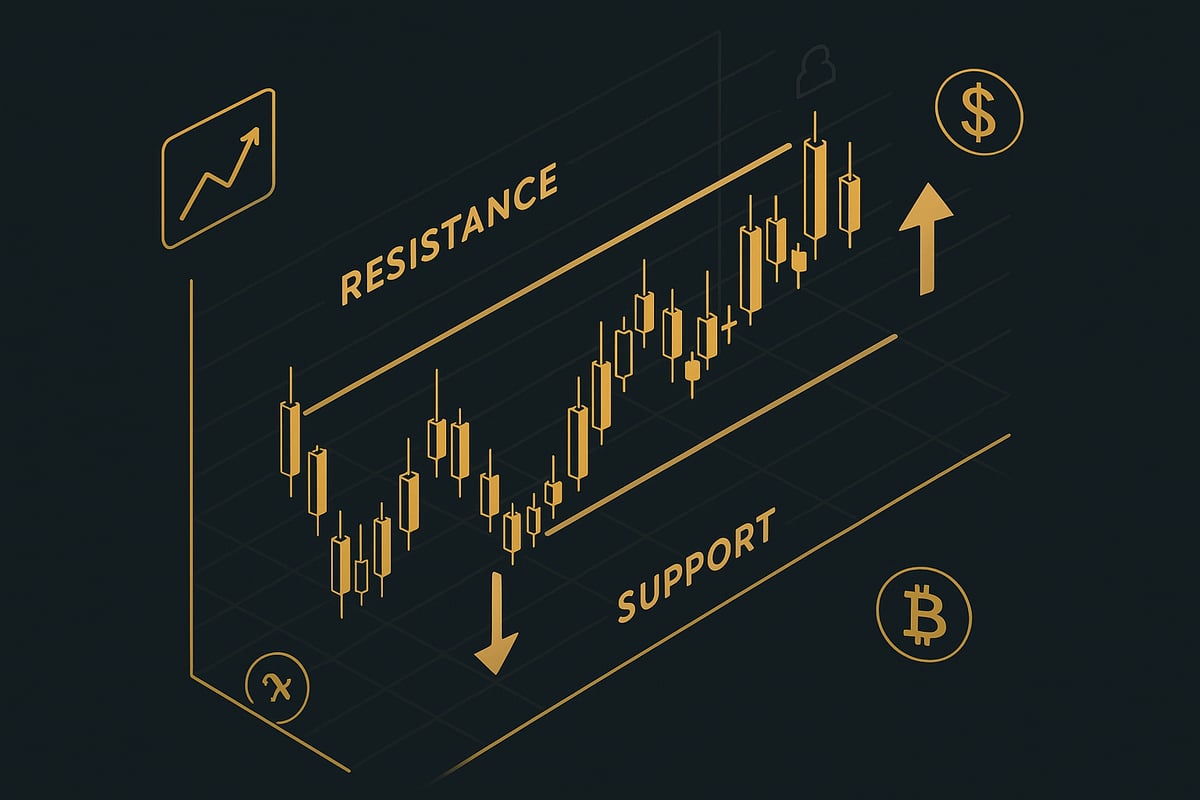
Support resistance trading begins with a firm grasp of two essential concepts: support and resistance. These levels form the backbone of technical analysis and are recognized across all asset classes, from stocks to crypto. When you see prices repeatedly bouncing at a certain level, such as the S&P 500 rebounding near 4,200, that is a classic example of support. Conversely, if prices struggle to rise above a ceiling, like stalling near 4,400, you are witnessing resistance in action. According to Reddit insights, support and resistance levels appear in 75% of technical trading strategies. Traders often use horizontal lines, price clusters, and previous highs or lows to visually pinpoint these zones. For a deeper dive into how to spot these levels on your charts, the Support and resistance indicator guide offers practical examples and tool recommendations.
What Are Support and Resistance?
In support resistance trading, support refers to a price level where strong buying interest halts further declines. Resistance is the opposite, where selling pressure caps upward moves. These concepts are vital because they act as psychological battlegrounds for buyers and sellers. For example, the S&P 500 repeatedly finding buyers at 4,200 illustrates support, while sellers clustering at 4,400 demonstrates resistance. Visual cues include drawing horizontal lines at these key price points, clustering around previous highs and lows, or identifying congestion zones. Data from Reddit suggests that support and resistance levels are present in 75% of technical strategies. Mastering their identification is the first step to effective support resistance trading.
Why Support and Resistance Matter in 2026
Despite the rise of AI and algorithmic trading, support resistance trading remains crucial in 2026. These levels continue to serve as psychological barriers for both retail and institutional traders. Even automated trading systems often use support and resistance to trigger entries and exits. This universality makes them essential for timing trades and managing risk. For instance, crypto markets, known for their volatility, frequently display strong reactions at support and resistance zones regardless of technological advancements. Accurate identification of these areas empowers traders to make better decisions, proving that support resistance trading is as relevant as ever.
The Psychology Behind S/R Levels
Psychology plays a central role in support resistance trading. When prices approach key levels, herd behavior often takes over, with many traders acting in unison. This collective focus can turn these zones into self-fulfilling prophecies, as the more traders watch an S/R level, the more likely price is to react there. Institutional order flow further amplifies the impact, as large players cluster orders around these levels to manage liquidity. Emotions like fear and greed intensify near support and resistance, leading to dramatic reversals or breakouts. On Reddit, traders frequently mention "waiting for pullbacks at demand zones," highlighting the psychological weight these areas carry in support resistance trading.
Types of Support and Resistance
Support resistance trading involves recognizing several types of levels. Static support and resistance are horizontal, drawn at fixed price points, while dynamic levels shift with trendlines or moving averages. Major S/R levels are tested repeatedly and attract high volume, whereas minor ones have less influence. Psychological round numbers, such as 10,000 on Bitcoin, often serve as powerful S/R zones. Timeframe matters too: daily support might hold more weight than an intraday level. For example, the 200-day moving average often acts as dynamic support in stocks, reinforcing the importance of combining multiple approaches in support resistance trading.
Methods to Identify Support and Resistance Levels
Identifying support and resistance levels is the backbone of effective support resistance trading. Mastering these methods gives traders the clarity to spot high-probability setups, time entries, and manage risk with confidence. In this section, we break down classic and advanced techniques to pinpoint these crucial levels, ensuring you have a robust toolkit for any market condition.

Classic Chart-Based Techniques
The foundation of support resistance trading lies in classic chart-based techniques. Traders manually draw horizontal lines at swing highs and lows, marking areas where price has historically reversed or stalled. These levels, often called congestion zones, are easy to spot by "looking left" on the chart and finding repeated reaction points.
For example, if the S&P 500 repeatedly bounces near 4,200, that level becomes a key support. Similarly, resistance forms where price fails to advance, such as 4,400. Most traders use simple drawing tools to highlight these zones, focusing on major pivots and clusters.
A basic table for reference:
| S/R Type | Visual Cue | Example Level |
|---|---|---|
| Support | Previous Lows | 4,200 |
| Resistance | Previous Highs | 4,400 |
This manual approach remains popular in support resistance trading due to its clarity and effectiveness.
Trendlines and Channels
Trendlines and channels are dynamic tools in support resistance trading. By connecting higher lows in an uptrend or lower highs in a downtrend, traders draw lines that act as sloping support or resistance. These trendlines help visualize the prevailing trend and potential reversal points.
Channels are created by drawing parallel lines above and below the price action, defining the range within which price oscillates. In trending markets, ascending or descending channels highlight both dynamic support and resistance.
For instance, in forex pairs, an ascending channel can guide long trades on pullbacks to the lower boundary. Remember, trendlines are only valid if price touches them multiple times, reinforcing their reliability in support resistance trading.
Moving Averages as Dynamic S/R
Moving averages (MAs) serve as dynamic support and resistance in support resistance trading. Commonly used periods include the 20, 50, 100, and 200. Prices often react to these averages, especially during strong trends.
For example, the 200 EMA is widely watched as support in uptrends. Traders observe how price interacts with the moving average—bounces or breaks can signal potential entries or exits. Combining moving averages with horizontal S/R levels creates a confluence zone, increasing the probability of a valid reaction.
However, moving averages are lagging indicators, so it is essential to use them alongside other methods for more precise support resistance trading decisions.
Fibonacci Retracements and Extensions
Fibonacci retracement and extension tools add mathematical precision to support resistance trading. By measuring the distance between a swing high and a swing low, traders plot key Fibonacci ratios—38.2%, 50%, and 61.8%—to identify zones where price may reverse or consolidate.
For example, the S&P 500 often retraces to the 61.8% level before resuming its trend. These Fibonacci zones work in both trending and corrective phases, providing objective reference points. If you want to dive deeper, explore this resource on Fibonacci retracement for support and resistance for step-by-step guidance and practical examples.
Integrating Fibonacci with other methods strengthens your support resistance trading strategy and reduces guesswork.
Volume Profile and Order Flow
Volume profile and order flow analysis bring an extra layer of insight to support resistance trading. High-volume nodes, where significant buying or selling occurs, often coincide with key S/R zones. By analyzing volume at specific price levels, traders identify where institutions and large players have taken positions.
For instance, if price stalls at a high-volume area on a futures chart, it signals a likely support or resistance. Some traders use dedicated volume indicators to confirm these zones, improving the robustness of their support resistance trading.
Order flow tools can further highlight liquidity pools, showing where large orders may cause reversals or accelerations in price. Combining volume with S/R levels adds conviction to trade setups.
Automated Tools and AI Indicators
Technology is transforming support resistance trading through automated tools and AI-driven indicators. Many charting platforms now offer auto-detection of support and resistance, instantly marking key levels based on historical price action.
AI indicators can analyze vast amounts of data, reducing subjectivity and highlighting S/R zones that might be missed manually. For example, TradingView’s auto S/R tools or advanced plugins can streamline your workflow.
However, while automation brings speed and consistency, it should augment—not replace—your own analysis. Human judgment remains crucial in adapting to changing market conditions and filtering out irrelevant levels in support resistance trading.
Trading Strategies Using Support and Resistance
Unlocking the power of support resistance trading requires more than simply spotting lines on a chart. Effective strategies allow traders to turn these key levels into actionable plans, combining precision, discipline, and adaptability. Below, explore practical methods to master entries, manage risk, and navigate the market confidently.

Range Trading: Buying Support, Selling Resistance
Range trading is a cornerstone of support resistance trading, especially during sideways markets. This strategy involves:
- Identifying a well-established price range using historical support and resistance.
- Waiting for price to approach these boundaries.
- Confirming entries with candlestick patterns or volume surges.
For example, when the Nasdaq oscillates between 13,500 (support) and 14,000 (resistance), traders look for buying opportunities near support and consider selling or shorting at resistance. Stop-loss orders are placed just beyond these levels to manage risk. According to market data, range-bound strategies often achieve win rates between 60 and 75 percent in stable conditions, making them reliable for disciplined traders using support resistance trading plans.
Breakout Trading: Riding Momentum Beyond S/R
Breakout trading harnesses the momentum that occurs when price finally breaches strong support or resistance. To execute this support resistance trading method:
- Watch for consolidation near a key level.
- Wait for a decisive close above resistance or below support, often confirmed by a volume surge.
- Enter trades on the breakout candle or after a retest.
Consider Bitcoin breaking through $30,000 resistance with an accompanying spike in volume. This signals potential for a sustained move. Place stop-loss orders just inside the broken level to guard against false breakouts. Reddit traders often highlight the value of monitoring lower timeframes for breakout confirmation when using support resistance trading.
Pullback and Retest Strategies
In support resistance trading, waiting for a pullback or retest can offer safer entry points. The process is:
- Let price break a major S/R level.
- Wait for it to return and "test" that level from the other side.
- Confirm with price action, such as pin bars or engulfing candles.
For instance, if EUR/USD breaks resistance, then pulls back to test it as support before rallying, that retest becomes an ideal entry zone. Manage risk by setting tight stops just beyond the retested level. This support resistance trading approach helps filter out false moves and keeps losses minimized.
Trend Following with Dynamic S/R
Support resistance trading is not limited to static lines. Dynamic S/R, such as moving averages and trendlines, can guide entries in trending markets. Steps include:
- Identify the prevailing trend.
- Use moving averages (like the 50-day MA) or trendlines as dynamic support in uptrends.
- Enter on pullbacks to these dynamic levels, especially when they align with horizontal S/R.
For example, the S&P 500 repeatedly bouncing off its 50-day MA during a bull run provides high-probability setups. Combining dynamic and static S/R levels in support resistance trading increases the odds of catching sustained trends.
Multi-Timeframe Analysis for S/R
A hallmark of advanced support resistance trading is multi-timeframe analysis. This means:
- Checking S/R alignment across daily, 4-hour, and 1-hour charts.
- Prioritizing trades that move in the direction of higher timeframe S/R.
- Avoiding positions that conflict with major levels on bigger charts.
For example, a day trade that aligns with weekly support offers extra conviction. Reddit traders frequently mention that multi-timeframe support resistance trading simplifies decision-making and improves profitability.
Confluence: Stacking S/R With Other Indicators
Stacking multiple signals is a proven way to boost support resistance trading accuracy. Combine S/R with indicators like RSI, MACD, or volume for stronger confirmation.
- Look for RSI divergence at resistance, or MACD crossovers near support.
- Validate S/R levels using volume. High volume at a level increases its significance.
- According to Reddit, strategies combining S/R with a secondary indicator can reach 75 percent accuracy.
For more on confirming S/R with volume, see this Volume indicator for S/R confirmation. This resource explains how volume spikes can validate the strength of support and resistance, making your support resistance trading decisions more robust.
Risk Management and Trade Planning
No support resistance trading strategy is complete without disciplined risk management. Key principles include:
- Placing stop-loss orders just beyond S/R zones to allow for normal volatility.
- Calculating position size based on distance to S/R and account risk tolerance.
- Setting realistic profit targets at the next S/R level.
For example, risk 1 percent per trade and aim for a 2:1 reward-to-risk ratio. Consistent risk management ensures that even a string of losses does not derail your trading capital, which is vital for long-term success in support resistance trading.
How AI Trading Indicators Enhance S/R Trading
AI trading indicators have revolutionized support resistance trading in recent years. Tools like PipTrend instantly highlight trend direction and S/R zones, filtering out noise and providing clear signals.
- Real-time alerts and visual cues speed up analysis.
- Multi-timeframe capabilities keep your trades in sync with dominant market flows.
- Institutional timing features help spot key liquidity and reversal zones.
Traders using AI-powered support resistance trading tools report fewer losses and faster learning curves. Whether you are a beginner or seasoned pro, integrating these solutions can elevate your confidence and results.
Advanced Support and Resistance Concepts for 2026
Navigating the modern market landscape requires a deep understanding of advanced support resistance trading concepts. As we approach 2026, rapid technological change, evolving market structure, and increased volatility make mastering these advanced techniques essential for consistent results.
Adaptive S/R in Algorithmic and AI-Driven Markets
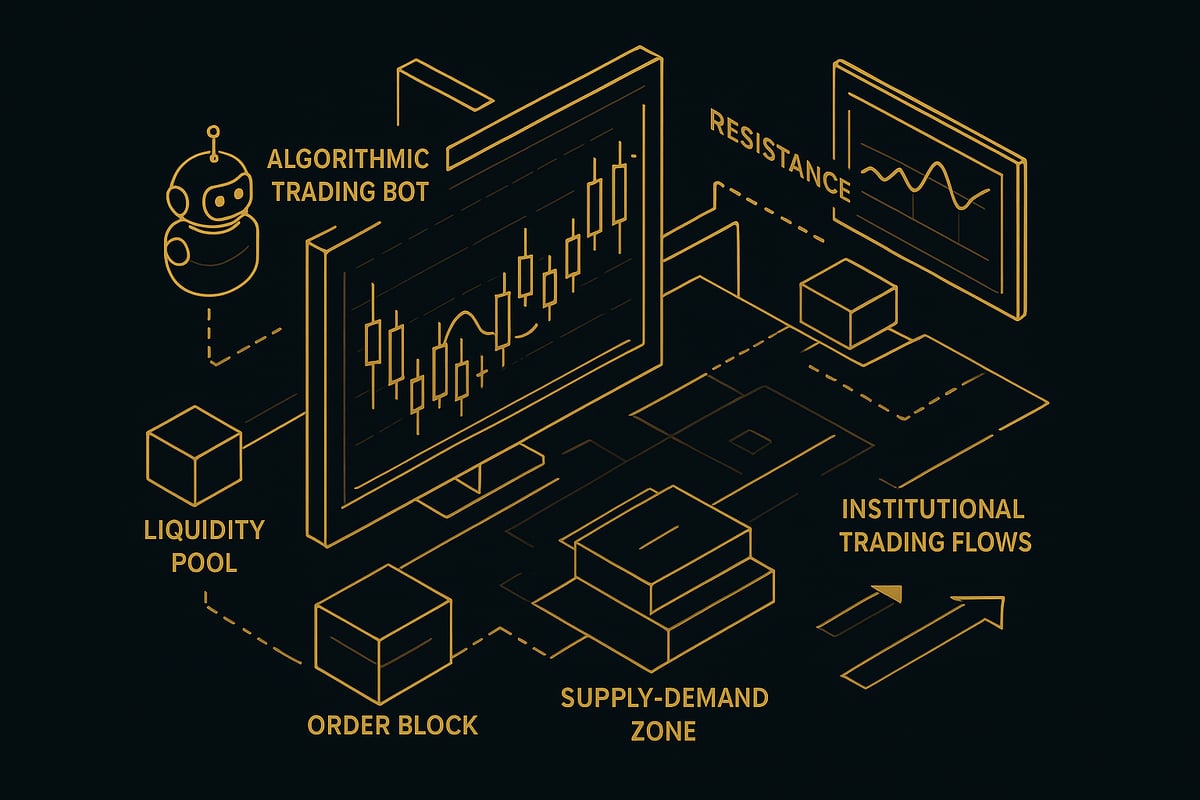
The rise of high-frequency trading and AI has transformed support resistance trading. Adaptive support and resistance levels now shift rapidly, reflecting real-time changes in order flow and market sentiment. Traditional static lines are often replaced by zones that move in response to algorithmic activity.
For example, crypto markets display swift S/R recalculation as bots respond to new data within seconds. Traders must use tools that track these dynamic zones, helping them avoid outdated levels and stay aligned with institutional flows. According to Support and resistance levels in algorithmic trading, integrating intelligent S/R features into trading models improves price prediction and aligns with how modern markets operate. Staying adaptive is crucial for effective support resistance trading in 2026.
Supply and Demand Zones vs. Traditional S/R
Support resistance trading increasingly incorporates supply and demand zones alongside classic S/R lines. Unlike precise horizontal levels, supply and demand zones are broader price areas where imbalances drive sharp moves.
Key differences:
| Traditional S/R | Supply/Demand Zones |
|---|---|
| Exact price levels | Broad price zones |
| Often static | Can shift over time |
| Focus on past highs/lows | Focus on volume imbalances |
For example, after a rapid sell-off, price may rally strongly from a demand zone, signaling institutional buying. In support resistance trading, integrating these zones helps identify where real market turning points occur, rather than relying solely on historical price reactions.
Liquidity Pools and Institutional Order Blocks
Understanding where large traders place their orders is vital for successful support resistance trading. Liquidity pools represent areas where significant volume is transacted, often attracting price to these zones.
Institutional order blocks are essentially hidden S/R areas where big players accumulate or distribute positions. When price approaches these blocks, reversals or strong continuations can occur. For instance, EUR/USD may reverse sharply at an order block, revealing institutional interest.
Spotting these zones involves analyzing volume spikes, price consolidations, and historical reaction points. Including liquidity pools and order blocks in support resistance trading strategies provides a more complete view of market structure and potential turning points.
False Breakouts and S/R Traps
False breakouts are a common pitfall in support resistance trading. They occur when price briefly moves beyond a level, only to reverse quickly, trapping traders on the wrong side.
Why do these traps happen?
- Stop hunts by larger players
- Temporary liquidity grabs
- Lack of confirming volume or momentum
For example, the S&P 500 may break above resistance, only to reverse within minutes, creating a "bull trap." To avoid S/R traps, traders should wait for confirmation, such as a retest of the level or strong volume support. Patience and discipline are essential for navigating support resistance trading in volatile conditions.
S/R in Volatile and News-Driven Markets
Major news events can instantly reshape support resistance trading plans. In volatile markets, S/R levels may shift or lose relevance within minutes after announcements.
Consider the impact of central bank decisions. An FOMC statement may cause immediate S/R adjustments as traders rapidly reassess fair value. Flexible traders update their levels in real-time, ensuring their support resistance trading remains relevant.
Quick reassessment and adaptability are key. Monitoring order flow and recent price action allows traders to respond effectively, keeping their support resistance trading strategies aligned with the latest market realities.
S/R for Different Asset Classes (Stocks, Forex, Crypto, Commodities)
Support resistance trading techniques must be tailored to each asset class. Every market has unique behaviors and S/R dynamics:
- Stocks: S/R often respects major moving averages and reacts to earnings or sector news.
- Forex: S/R clusters around session opens, closes, and macroeconomic releases.
- Crypto: 24/7 trading and psychological round numbers make S/R zones highly reactive.
- Commodities: S/R influenced by seasonality, inventory reports, and geopolitical factors.
For example, gold regularly tests $2,000 as resistance, while Bitcoin responds to round numbers like $30,000. Understanding these nuances enhances support resistance trading, allowing traders to adapt their approach for each market environment.
Common Mistakes and How to Avoid Them
Support resistance trading is powerful, but even seasoned traders can stumble over common pitfalls. By recognizing these mistakes early, you can avoid costly errors and build a more robust approach to support resistance trading.
Overcomplicating S/R Analysis
One of the most frequent mistakes in support resistance trading is cluttering charts with too many lines. Traders often mark every swing high and low, hoping more information leads to better decisions. Instead, this creates confusion and dilutes the true significance of key levels.
- Marking every minor peak or trough
- Ignoring high-volume or major S/R
- Losing sight of the market's bigger picture
Focus on the most relevant support and resistance zones. Prioritize levels with multiple historical touches or those aligning with high trading volume. Simplifying your chart helps you filter out noise and make clearer, faster trading decisions. Remember, the quality of S/R levels matters far more than quantity when it comes to support resistance trading.
Ignoring Market Context and Timeframes
Trading support resistance trading levels without considering the broader market context can lead to poor outcomes. Many traders make the mistake of going against the prevailing trend or ignoring higher timeframe S/R zones.
For example, selling short at a daily resistance might seem logical, but if the weekly trend is bullish and price is above major support, the odds are not in your favor. Always analyze where your chosen S/R fits within the larger market structure.
- Align trades with dominant trend direction
- Confirm S/R levels across multiple timeframes
- Avoid countertrend trades unless clear signals emerge
Proper context helps you avoid fighting the market and increases your probability of success in support resistance trading.
Failing to Wait for Confirmation
Jumping into trades at S/R levels without confirmation is another classic pitfall in support resistance trading. Traders often assume that price will immediately react to a zone, only to be caught by false breaks or continued moves against their position.
Confirmation can come from price action signals, volume spikes, or indicator confluence. For example, a bullish reversal candle at support or a volume surge at resistance increases the reliability of the level.
- Wait for candlestick patterns or indicators to confirm the reaction
- Use confluence with other tools for added confidence
- Avoid impulsive entries
Understanding the role of trading psychology and S/R levels can also help you stay patient, reducing the urge to enter prematurely and improving your discipline in support resistance trading.
Poor Risk Management Around S/R
Effective risk management is a cornerstone of support resistance trading, yet many traders set stops too tight or too loose, or overleverage due to misplaced confidence in a level. Placing a stop right at the S/R line often results in getting stopped out by a minor price wick, while wide stops can lead to larger losses.
- Use buffer zones beyond S/R for stop placement
- Adjust position size based on distance to stop
- Avoid risking more than a small percentage per trade
Research, such as the study on optimizing day trading with ATR and LWTI, highlights the benefits of integrating volatility measures into S/R strategies for smarter stop and target placement. By respecting risk management principles, you protect your capital and ensure long-term success with support resistance trading.
Pro Tips and Best Practices for Mastering S/R in 2026
Mastering support resistance trading in 2026 is not just about drawing lines on a chart. It requires a disciplined approach, the right tools, continuous learning, and a resilient mindset. Let us explore the top pro tips and best practices that can elevate your results and confidence as a modern trader.
Developing Your S/R Trading Plan
A robust support resistance trading plan starts with a systematic process. First, identify major support and resistance zones using historical price action and volume. Next, confirm these levels with multiple methods, such as moving averages or Fibonacci retracements. Once confirmed, plan your entries, exits, and stop-losses in advance.
Journaling is essential. Record each trade, the rationale behind your entries and exits, and the outcome. This habit uncovers patterns in your decision-making and highlights areas for improvement. For those seeking a deeper theoretical foundation, consider analyzing support and resistance via optimal stopping. This framework can help structure your trading decisions with mathematical rigor and clarity.
A well-documented plan brings consistency and discipline, the cornerstones of long-term success in support resistance trading.
Leveraging Technology and Community Insights
Modern support resistance trading benefits immensely from technology and collective knowledge. Advanced charting platforms and AI-powered indicators can quickly identify key levels and alert you to evolving market conditions. Integrating these tools streamlines your analysis and reduces manual errors.
Participating in online trading communities, such as Reddit or TradingView, exposes you to live discussions, fresh perspectives, and real-time updates on support and resistance zones. Many traders share annotated charts, discuss setups, and offer feedback, accelerating your learning curve.
Combining the power of smart tools with the experience of a community ensures you never trade in isolation. It keeps your support resistance trading approach sharp and adaptable.
Continuous Learning and Market Adaptation
Financial markets are dynamic, especially as AI and algorithms reshape the trading landscape. Successful support resistance trading demands ongoing education and adaptability. Regularly review your strategies, study new research, and embrace emerging technologies.
For advanced traders, enhancing trading strategies with ensemble RL introduces reinforcement learning models that adapt to changing risk-return profiles. Exploring such methodologies can futureproof your trading edge.
Commit to continuous improvement by attending webinars, reading research papers, and testing new tools. The ability to evolve separates profitable support resistance trading from outdated approaches.
Mindset and Discipline for S/R Traders
Emotional control is vital in support resistance trading. Even the best plans can falter if discipline slips. Avoid revenge trades after losses, and never force entries when the market is unclear.
Patience pays off. Wait for clear confirmation at support and resistance levels before acting. Professional traders prioritize process over prediction, trusting their plan rather than gut feelings.
By cultivating a disciplined mindset, you protect your capital and maintain consistency. This psychological edge is often the deciding factor in long-term support resistance trading success.
If you’re ready to stop second guessing your trades and want a clearer path to mastering support and resistance in today’s fast moving markets, you’re not alone. We’ve covered how crucial it is to have reliable tools that cut through noise and confirm your strategy across timeframes—exactly what you need for consistency and confidence. PipTrend is designed to give you instant clarity, real time alerts, and the edge you’ve been looking for. Why not experience the difference for yourself?
Start Catching Winning Trades, Right Now!